
Ch.12 - Parametric and Polar Curves
Briggs - Calculus: Early Transcendentals 3rd Edition
Briggs3rd EditionCalculus: Early TranscendentalsISBN: 9780136847243당신이 사용하는 게 아니라요?교과서 변경
12장, 문제 12.2.60

57–64. Graphing polar curves Graph the following equations. Use a graphing utility to check your work and produce a final graph.


r² = 4 sin θ  

검증된 단계별 안내
1
Recognize that the given equation is in polar form: \(r^{2} = 4 \sin \theta\). Our goal is to understand the shape of this curve by analyzing and possibly converting it to Cartesian coordinates or by studying its behavior in polar coordinates.
Recall the relationships between polar and Cartesian coordinates: \(x = r \cos \theta\), \(y = r \sin \theta\), and \(r^{2} = x^{2} + y^{2}\). These will help us rewrite the equation in a more familiar form if needed.
Substitute \(r^{2} = x^{2} + y^{2}\) and \(\sin \theta = \frac{y}{r}\) into the equation: \(r^{2} = 4 \sin \theta\) becomes \(x^{2} + y^{2} = 4 \cdot \frac{y}{r}\). Multiply both sides by \(r\) to eliminate the denominator, remembering that \(r = \sqrt{x^{2} + y^{2}}\).
After multiplying, you get \((x^{2} + y^{2}) \cdot r = 4y\). Substitute \(r = \sqrt{x^{2} + y^{2}}\) back in to get \((x^{2} + y^{2}) \sqrt{x^{2} + y^{2}} = 4y\). This is a Cartesian form that can help identify the curve's shape.
Analyze the resulting equation or use the original polar form to plot points for various values of \(\theta\) between \(0\) and \(2\pi\). Note the symmetry and key points (like where \(r=0\) or \(r\) is maximum) to sketch the graph. Finally, use a graphing utility to verify your sketch.

비슷한 문제에 대한 검증된 영상 답변:

이 영상 해법은 위 문제에 도움이 된다고 튜터들이 추천한 것입니다.
영상 길이:
4m
도움이 되었나요?

주요 개념

질문에 올바르게 답하기 위해 반드시 이해해야 하는 핵심 개념들은 다음과 같습니다.

Polar Coordinates and Polar Equations

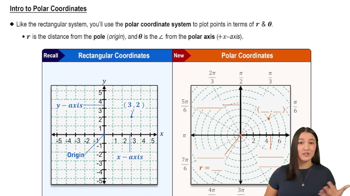
Polar coordinates represent points using a radius and an angle (r, θ) instead of Cartesian (x, y). Understanding how to interpret and plot equations in polar form, such as r² = 4 sin θ, is essential for graphing curves defined by radius as a function of angle.
추천 영상:
05:32
Intro to Polar Coordinates

Graphing Polar Curves

Graphing polar curves involves plotting points for various values of θ and corresponding r values, then connecting these points smoothly. Recognizing symmetry and key features like intercepts and maximum radius helps in sketching accurate graphs of polar equations.
추천 영상:
09:04
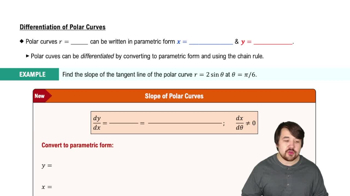
Slope of Polar Curves

Using Graphing Utilities for Polar Graphs

Graphing utilities can plot polar equations quickly and accurately, allowing verification of manual sketches. Familiarity with inputting polar equations and interpreting the resulting graphs aids in understanding the shape and behavior of complex polar curves.
추천 영상:
06:15
Graphing The Derivative