Ch. 1 - Functions
Hass - Thomas' Calculus 15th Edition
Hass15th EditionThomas' CalculusISBN: 9780137616077당신이 사용하는 게 아니라요?교과서 변경
1장, 문제 62

In Exercises 59–62, sketch the graph of the given function. What is the period of the function?


𝔂 = cos πx/2

검증된 단계별 안내
1
Step 1: Identify the function type. The given function is y = cos(πx/2), which is a cosine function. Cosine functions are periodic and have a characteristic wave-like shape.
Step 2: Determine the period of the function. The period of a cosine function y = cos(bx) is given by the formula: 2π. For y = cos(πx/2), b = π/2, so the period is 2π * 2π = 4.
Step 3: Sketch the graph. Start by plotting key points of the cosine function within one period. For y = cos(πx/2), the period is 4, so plot points at x = 0, 1, 2, 3, and 4. At x = 0, y = cos(0) = 1; at x = 2, y = cos(π) = -1; at x = 4, y = cos(2π) = 1.
Step 4: Draw the wave pattern. Connect the plotted points with a smooth curve to form the cosine wave. The graph should start at y = 1, dip to y = -1 at x = 2, and return to y = 1 at x = 4, completing one full cycle.
Step 5: Extend the graph. Since the cosine function is periodic, repeat the wave pattern for additional cycles to the left and right of the initial period, maintaining the same amplitude and period.

비슷한 문제에 대한 검증된 영상 답변:

이 영상 해법은 위 문제에 도움이 된다고 튜터들이 추천한 것입니다.
영상 길이:
6m
도움이 되었나요?

주요 개념

질문에 올바르게 답하기 위해 반드시 이해해야 하는 핵심 개념들은 다음과 같습니다.

Period of a Function

The period of a function is the length of the interval over which the function repeats itself. For trigonometric functions like cosine, the period can be determined from the coefficient of the variable inside the function. Specifically, for the cosine function, the standard period is 2π, but it can be adjusted based on the function's equation.
추천 영상:
가이드 코스
6:22
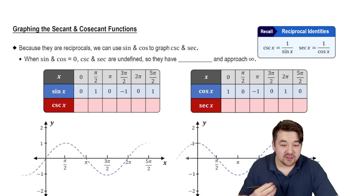
Graphs of Secant and Cosecant Functions

Graphing Trigonometric Functions

Graphing trigonometric functions involves understanding their key features, such as amplitude, period, phase shift, and vertical shift. For the cosine function, the graph oscillates between -1 and 1, with peaks at the maximum and minimum values. Identifying these characteristics helps in accurately sketching the graph.
추천 영상:
가이드 코스
6:04
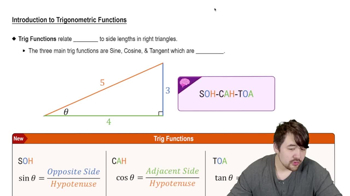
Introduction to Trigonometric Functions

Transformations of Functions

Transformations of functions refer to changes made to the basic function to alter its graph. This includes vertical and horizontal shifts, stretching, and compressing. In the case of 𝔶 = cos(πx/2), the coefficient π/2 affects the period and can also influence the graph's appearance, requiring careful consideration when sketching.
추천 영상:
가이드 코스
5:25
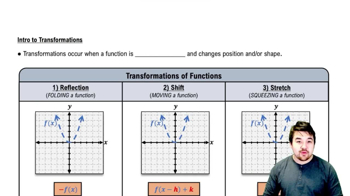
Intro to Transformations