


Ch. 3 - Derivatives
Hass - Thomas' Calculus 15th Edition
Hass15th EditionThomas' CalculusISBN: 9780137616077당신이 사용하는 게 아니라요?교과서 변경
3장, 문제 3.1.24a

Interpreting Derivative Values


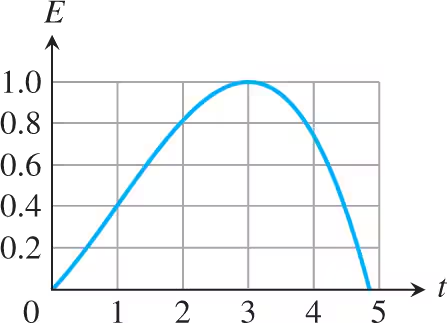
Effectiveness of a drug On a scale from 0 to 1, the effectiveness E of a pain-killing drug t hours after entering the bloodstream is displayed in the accompanying figure.


<IMAGE>
a. At what times does the effectiveness appear to be increasing? What is true about the derivative at those times?

검증된 단계별 안내
1
Step 1: Observe the graph of the effectiveness E versus time t. The effectiveness E increases from t = 0 to t = 3, as the curve slopes upward during this interval.
Step 2: Recall that the derivative of a function represents the rate of change of the function. When the effectiveness E is increasing, the derivative dE/dt is positive.
Step 3: Identify the interval where the slope of the graph is positive. From the graph, the slope is positive from t = 0 to t = 3, indicating that the derivative dE/dt > 0 during this interval.
Step 4: Note that at t = 3, the graph reaches its maximum point, where the slope becomes zero. This means the derivative dE/dt = 0 at t = 3.
Step 5: Conclude that the effectiveness appears to be increasing during the interval 0 < t < 3, and the derivative is positive during this time.

비슷한 문제에 대한 검증된 영상 답변:

이 영상 해법은 위 문제에 도움이 된다고 튜터들이 추천한 것입니다.
영상 길이:
2m
도움이 되었나요?

주요 개념

질문에 올바르게 답하기 위해 반드시 이해해야 하는 핵심 개념들은 다음과 같습니다.

Derivative and Increasing Function

The derivative of a function at a point gives the slope of the tangent line at that point. If the derivative is positive over an interval, the function is increasing on that interval. In the context of the drug's effectiveness, the derivative E'(t) is positive when the effectiveness is increasing, which can be observed from the graph where the slope is upward.
추천 영상:
07:32
Determining Where a Function is Increasing & Decreasing

Critical Points and Maximum Effectiveness

Critical points occur where the derivative is zero or undefined, often indicating potential maxima or minima. In the graph, the effectiveness reaches a maximum when the derivative changes from positive to negative, which is around t = 3 hours. This is where the drug's effectiveness is at its peak before it starts to decrease.
추천 영상:
04:50
Critical Points

Interpreting Graphs in Calculus

Understanding how to interpret graphs is crucial in calculus. The graph of E(t) shows the effectiveness of the drug over time. By analyzing the slope of the graph, one can determine intervals of increase or decrease. The graph indicates that the effectiveness increases from t = 0 to t = 3 and decreases thereafter, which aligns with the derivative's behavior.
추천 영상:
가이드 코스
05:22
Fundamental Theorem of Calculus Part 2