
Ch. 3 - Derivatives
Hass - Thomas' Calculus 15th Edition
Hass15th EditionThomas' CalculusISBN: 9780137616077당신이 사용하는 게 아니라요?교과서 변경
3장, 문제 18a

Understanding Motion from Graphs


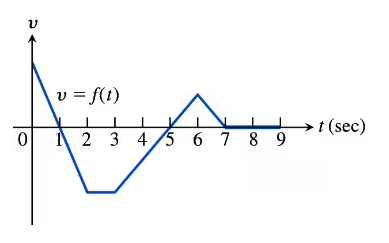
The accompanying figure shows the velocity v = f(t) of a particle moving on a horizontal coordinate line.


a. When does the particle move forward? Move backward? Speed up? Slow down?
graph

검증된 단계별 안내
1
To determine when the particle moves forward, look for intervals where the velocity v = f(t) is positive. This occurs when the graph is above the t-axis.
To determine when the particle moves backward, look for intervals where the velocity v = f(t) is negative. This occurs when the graph is below the t-axis.
To determine when the particle speeds up, identify intervals where the magnitude of velocity is increasing. This can be seen when the graph is moving away from the t-axis, either upwards or downwards.
To determine when the particle slows down, identify intervals where the magnitude of velocity is decreasing. This can be seen when the graph is moving towards the t-axis, either upwards or downwards.
Analyze the graph: From t = 0 to t = 1, the particle moves forward and slows down. From t = 1 to t = 3, it moves backward and speeds up. From t = 3 to t = 5, it moves backward and slows down. From t = 5 to t = 6, it moves forward and speeds up. From t = 6 to t = 7, it moves forward and slows down. From t = 7 to t = 9, the velocity is zero, indicating no movement.

비슷한 문제에 대한 검증된 영상 답변:

이 영상 해법은 위 문제에 도움이 된다고 튜터들이 추천한 것입니다.
영상 길이:
2m
도움이 되었나요?

주요 개념

질문에 올바르게 답하기 위해 반드시 이해해야 하는 핵심 개념들은 다음과 같습니다.

Velocity and Direction of Motion

Velocity is a vector quantity that indicates the rate of change of position with respect to time. When the velocity is positive, the particle moves forward; when negative, it moves backward. Understanding the sign of the velocity function is crucial for determining the direction of motion.
추천 영상:
가이드 코스
06:29
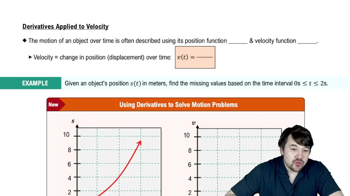
Derivatives Applied To Velocity

Acceleration and Speed Changes

Acceleration is the rate of change of velocity. A particle speeds up when the velocity and acceleration have the same sign (both positive or both negative) and slows down when they have opposite signs. Analyzing the graph for intervals where the velocity is increasing or decreasing helps identify these changes.
추천 영상:
가이드 코스
06:15
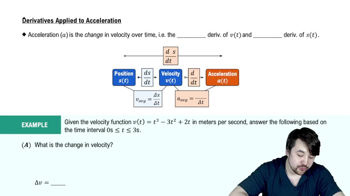
Derivatives Applied To Acceleration

Graph Interpretation

Interpreting the graph of velocity over time involves analyzing its shape and key features, such as peaks, troughs, and zero crossings. These features indicate when the particle is at rest (velocity = 0), changing direction, or experiencing changes in speed, which are essential for answering questions about motion.
추천 영상:
가이드 코스
06:15
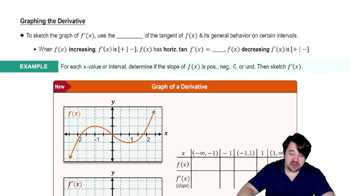
Graphing The Derivative
관련 실천
교과서 질문

Understanding Motion from Graphs


Launching a Rocket When a model rocket is launched, the propellant burns for a few seconds, accelerating the rocket upward. After burnout, the rocket coasts upward for a while and then begins to fall. A small explosive charge pops out a parachute shortly after the rocket starts down. The parachute slows the rocket to keep it from breaking when it lands.


The figure here shows velocity data from the flight of the model rocket. Use the data to answer the following.


d. When did the parachute pop out? How fast was the rocket falling then?


213
views
교과서 질문

Understanding Motion from Graphs


Launching a Rocket When a model rocket is launched, the propellant burns for a few seconds, accelerating the rocket upward. After burnout, the rocket coasts upward for a while and then begins to fall. A small explosive charge pops out a parachute shortly after the rocket starts down. The parachute slows the rocket to keep it from breaking when it lands.


The figure here shows velocity data from the flight of the model rocket. Use the data to answer the following.


c. When did the rocket reach its highest point? What was its velocity then?


225
views
교과서 질문

Understanding Motion from Graphs


Launching a Rocket When a model rocket is launched, the propellant burns for a few seconds, accelerating the rocket upward. After burnout, the rocket coasts upward for a while and then begins to fall. A small explosive charge pops out a parachute shortly after the rocket starts down. The parachute slows the rocket to keep it from breaking when it lands.


The figure here shows velocity data from the flight of the model rocket. Use the data to answer the following.


f. When was the rocket’s acceleration greatest?


224
views
교과서 질문

Understanding Motion from Graphs


The accompanying figure shows the velocity v = f(t) of a particle moving on a horizontal coordinate line.


c. When does the particle move at its greatest speed?

214
views
교과서 질문

Understanding Motion from Graphs


The accompanying figure shows the velocity v = f(t) of a particle moving on a horizontal coordinate line.


d. When does the particle stand still for more than an instant?

247
views
교과서 질문

Understanding Motion from Graphs


The accompanying figure shows the velocity v = f(t) of a particle moving on a horizontal coordinate line.


b. When is the particle’s acceleration positive? Negative? Zero?

230
views