Ch. 4 - Applications of Derivatives
Hass - Thomas' Calculus 15th Edition
Hass15th EditionThomas' CalculusISBN: 9780137616077당신이 사용하는 게 아니라요?교과서 변경
4장, 문제 4.2.15aiv

Roots (Zeros)


a. Plot the zeros of each polynomial on a line together with the zeros of its first derivative.


iv. y = x³ − 33x² + 216x = x(x - 9)(x − 24)

검증된 단계별 안내
1
Identify the zeros of the polynomial y = x³ − 33x² + 216x. The polynomial is factored as y = x(x - 9)(x - 24), so the zeros are x = 0, x = 9, and x = 24.
Find the first derivative of the polynomial y = x³ − 33x² + 216x. Use the power rule for differentiation: if y = ax^n, then dy/dx = n*ax^(n-1).
Apply the power rule to each term: the derivative of x³ is 3x², the derivative of -33x² is -66x, and the derivative of 216x is 216. Therefore, the first derivative is y' = 3x² - 66x + 216.
Find the zeros of the first derivative y' = 3x² - 66x + 216. Set the derivative equal to zero: 3x² - 66x + 216 = 0. This is a quadratic equation.
Solve the quadratic equation 3x² - 66x + 216 = 0 using the quadratic formula x = (-b ± √(b² - 4ac)) / 2a, where a = 3, b = -66, and c = 216. Calculate the discriminant and find the roots.

비슷한 문제에 대한 검증된 영상 답변:

이 영상 해법은 위 문제에 도움이 된다고 튜터들이 추천한 것입니다.
영상 길이:
2m
도움이 되었나요?

주요 개념

질문에 올바르게 답하기 위해 반드시 이해해야 하는 핵심 개념들은 다음과 같습니다.

Roots (Zeros) of a Polynomial

The roots or zeros of a polynomial are the values of x for which the polynomial equals zero. For the polynomial y = x³ − 33x² + 216x, the roots are found by setting y to zero and solving the equation x(x - 9)(x - 24) = 0, giving the roots x = 0, x = 9, and x = 24. These points are where the graph of the polynomial intersects the x-axis.
추천 영상:
6:04
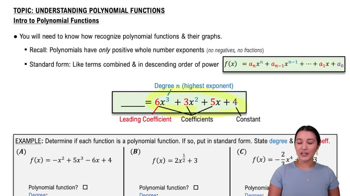
Introduction to Polynomial Functions

First Derivative and Critical Points

The first derivative of a function, denoted as y', represents the rate of change or slope of the function. For y = x³ − 33x² + 216x, the first derivative is y' = 3x² - 66x + 216. The zeros of the first derivative, found by solving 3x² - 66x + 216 = 0, indicate critical points where the function's slope is zero, potentially corresponding to local maxima, minima, or points of inflection.
추천 영상:
04:50
Critical Points

Graphical Representation of Zeros

Plotting the zeros of a polynomial and its derivative on a number line helps visualize the relationship between the function and its rate of change. The zeros of the polynomial indicate where the function crosses the x-axis, while the zeros of the derivative show where the slope is zero. This graphical approach aids in understanding the function's behavior, such as identifying intervals of increase or decrease and locating turning points.
추천 영상:
6:37
Zero and Negative Rules