 뒤로
뒤로Analyzing a Piecewise Function from Its Graph
스터디 가이드 - 스마트 노트
 자료에 맞춘 맞춤형 노트, 핵심 정의, 예시, 맥락을 확장해 제공합니다.
Q2. Consider the following graph of :
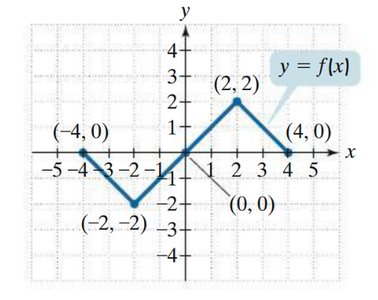
Parts:
(a) Find:
x-intercepts
y-intercept
(b) Relative Extrema:
Maximums
Minimums
(c) Intervals where the function is:
Increasing
Decreasing
Constant
(d) Find:
Background
Topic: Graphical Analysis of Functions
This question tests your ability to interpret a function's graph, including identifying intercepts, extrema, intervals of increase/decrease/constant, and evaluating the function at specific points.
Key Terms:
x-intercept: The point(s) where the graph crosses the x-axis ().
y-intercept: The point where the graph crosses the y-axis ().
Relative maximum/minimum: Highest/lowest points in a local region of the graph.
Increasing interval: Where the graph moves upward as increases.
Decreasing interval: Where the graph moves downward as increases.
Constant interval: Where the graph is flat (horizontal).
Step-by-Step Guidance
To find the x-intercepts, look for points where the graph crosses the x-axis. These are points where .
To find the y-intercept, locate the point where the graph crosses the y-axis. This is where .
For relative extrema, identify the highest and lowest points in each segment of the graph. These are local maximums and minimums.
To determine intervals of increase, decrease, and constant, observe the direction of the graph as increases. If the graph goes up, it's increasing; if it goes down, it's decreasing; if it's flat, it's constant.
To evaluate and , find the corresponding values for and on the graph.
Try solving on your own before revealing the answer!
