 뒤로
뒤로College Algebra Study Notes: Systems of Linear Equations, Linear Functions, and Inequalities
스터디 가이드 - 스마트 노트
 자료에 맞춘 맞춤형 노트, 핵심 정의, 예시, 맥락을 확장해 제공합니다.
Systems of Linear Equations and Linear Functions
Introduction to Systems of Linear Equations
Systems of linear equations involve finding values for variables that satisfy multiple linear equations simultaneously. These systems are foundational in algebra and have applications in modeling real-world scenarios, such as economics, engineering, and science.
System of Equations: A set of two or more equations with the same variables.
Solution: The set of variable values that satisfy all equations in the system.
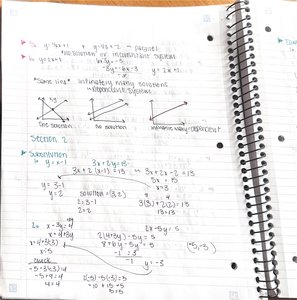
Types of Solutions:
One Solution: The lines intersect at a single point (consistent and independent).
No Solution: The lines are parallel and never intersect (inconsistent).
Infinitely Many Solutions: The lines coincide (consistent and dependent).
Applications: Used to solve problems involving relationships between quantities, such as supply and demand, mixture problems, and investment scenarios.
Methods for Solving Systems of Linear Equations
There are several methods to solve systems of linear equations, each with its own advantages depending on the context of the problem.
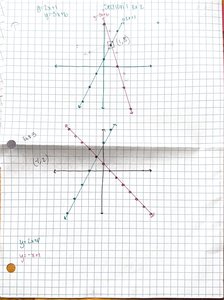
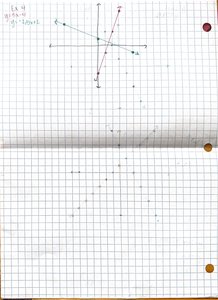
Graphing: Plot each equation on the coordinate plane and identify the intersection point(s).
Substitution: Solve one equation for one variable and substitute into the other equation.
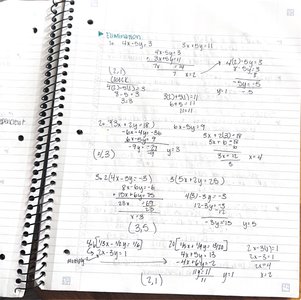
Elimination (Addition): Add or subtract equations to eliminate one variable, then solve for the remaining variable.
Example (Substitution):
Given: and
Set
Solve for :
Substitute into :
Solution:
Example (Elimination):
Given: and
Multiply equations as needed to align coefficients, then add or subtract to eliminate a variable.
Graphical Interpretation of Solutions
Graphing systems of equations provides a visual understanding of the solution types. The intersection point(s) represent the solution(s) to the system.
One Solution: Lines intersect at a single point.
No Solution: Lines are parallel and do not intersect.
Infinitely Many Solutions: Lines overlap completely.
Modeling with Linear Functions
Linear Equations in Real-World Contexts
Linear equations are used to model relationships between quantities that change at a constant rate. Applications include predicting population growth, financial investments, and business revenue.
General Form: , where is the slope and is the y-intercept.
Application Example: Predicting the average age of women having their first child using a linear model.
Steps:
Identify variables and assign them to and .
Determine the slope () and y-intercept () from data or context.
Write the equation and use it to make predictions.
Example: If models the average age in year since 1990, predict the age in 2020 ():
Systems of Linear Inequalities
Graphing and Interpreting Linear Inequalities
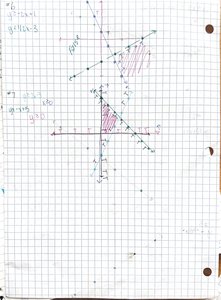
Systems of linear inequalities define regions in the coordinate plane that satisfy all given inequalities. The solution is the overlapping (shaded) region.
Linear Inequality: An inequality involving a linear function, such as .
Graphing Steps:
Graph each boundary line (solid for or , dashed for or ).
Shade the region that satisfies the inequality.
The solution to the system is where the shaded regions overlap.
Solving and Graphing Linear Equations and Inequalities
Solving Linear Equations
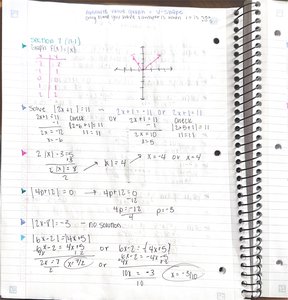
Solving linear equations involves isolating the variable using algebraic operations. The solution is the value that makes the equation true.
Example: Solve
Subtract 3:
Divide by 2:
Solving and Graphing Linear Inequalities
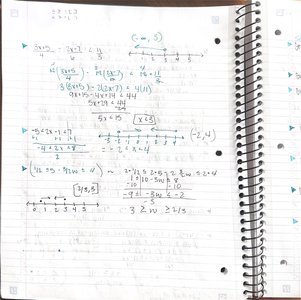
Linear inequalities are solved similarly to equations, but the solution is often a range of values. The solution can be represented on a number line or in interval notation.
Example: Solve
Add 5:
Divide by 2:
Graph: Shade all values to the left of 7 on the number line.
Applications and Word Problems
Modeling with Systems of Equations
Many real-world problems can be modeled using systems of equations. These include mixture problems, investment scenarios, and rate problems.
Mixture Problem Example: Mixing two solutions with different concentrations to achieve a desired concentration.
Investment Problem Example: Allocating funds between two accounts with different interest rates to achieve a target return.
Example: A person invests dollars at 5% and dollars at 7% to earn $200 in interest. The system is:
Summary Table: Types of Solutions for Systems of Linear Equations
Type of System | Graphical Representation | Number of Solutions | Description |
|---|---|---|---|
Consistent & Independent | Intersecting lines | One | Exactly one solution (point of intersection) |
Inconsistent | Parallel lines | None | No solution (lines never meet) |
Consistent & Dependent | Coinciding lines | Infinitely many | All points on the line are solutions |
Key Formulas and Concepts
Slope-Intercept Form:
Standard Form:
Point-Slope Form:
Solving by Substitution: Substitute one equation into the other to solve for one variable.
Solving by Elimination: Add or subtract equations to eliminate a variable, then solve for the other variable.
