 뒤로
뒤로College Algebra Test 3 Review – Step-by-Step Study Guidance
스터디 가이드 - 스마트 노트
 자료에 맞춘 맞춤형 노트, 핵심 정의, 예시, 맥락을 확장해 제공합니다.
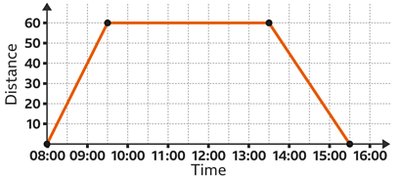
Q17. Suppose Chuck heads to a job site at 8:00 am. After 4 hours, he heads back home. The graph gives the distance, in miles, from home.
Background
Topic: Piecewise and Linear Functions, Interpreting Graphs
This question tests your ability to interpret a distance-time graph, describe domain and range, and understand how shifts in the graph relate to changes in the scenario (such as starting at a different time or distance).
Key Terms and Concepts:
Domain: The set of all possible input values (here, time intervals).
Range: The set of all possible output values (here, distances from home).
Graph Shifts: Horizontal shifts correspond to changes in start time; vertical shifts correspond to changes in starting distance.
Step-by-Step Guidance
Examine the graph and identify the time interval during which Chuck is traveling. Note the starting and ending times on the x-axis (time) and the corresponding distances on the y-axis.
Determine the domain by finding the earliest and latest times shown on the graph where Chuck's journey is represented.
Determine the range by identifying the minimum and maximum distances Chuck is from home during the journey.
For part (b), consider how the graph would change if Chuck started his journey at 8:30 am instead of 8:00 am. Think about how this affects the x-values (time) on the graph.
For part (c), consider how the graph would change if Chuck started 10 miles from home. Think about how this affects the y-values (distance) on the graph.
Try solving on your own before revealing the answer!
Final Answer:
a) Domain: [8, 15.5] (or [8:00 am, 3:30 pm]); Range: [0, 60]
b) The graph shifts right by 0.5 hours (30 minutes) to start at 8:30 am.
c) The graph shifts up by 10 units, so the range becomes [10, 70].
The domain is determined by the time interval shown, and the range by the minimum and maximum distances. Shifting the graph right corresponds to a later start time, and shifting up corresponds to starting farther from home.
Q25. The expected life span of people in the U.S. can be described by , where is the number of years since 1900.
Background
Topic: Logarithmic Functions, Function Evaluation, and Graph Interpretation
This question tests your ability to evaluate logarithmic functions, set up equations to solve for unknowns, and interpret solutions using a graph.
Key Terms and Formulas:
Natural Logarithm (): The logarithm with base .
Function Evaluation: Substitute the given value for into the function.
Solving for : Set the function equal to a value and solve for algebraically or graphically.
Step-by-Step Guidance
For part (a), determine the value of for people born in 1925. Recall that $x$ is the number of years since 1900, so .
Substitute this value of into the function to estimate the life span.
For part (b), set up the equation to find the year when the estimated life span is 68.
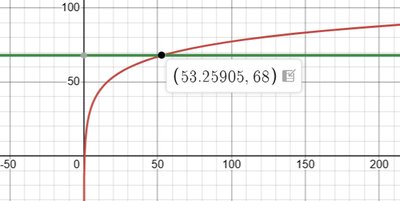
For part (c), use the graph to estimate the value of where the function reaches 68. Look for the intersection point on the graph where .
For part (d), solve the equation from part (b) algebraically for . Isolate and then exponentiate both sides to solve for $x$.
Try solving on your own before revealing the answer!
Final Answer:
a) For , years.
b) Set up:
c) From the graph, (so the year is or 1954).
d) Algebraically: , so
The graph and algebraic solution agree, confirming the year is about 1953–1954 when the life span reaches 68 years.
