 뒤로
뒤로Functions and Graphs: Basics of Functions and Their Graphs
스터디 가이드 - 스마트 노트
 자료에 맞춘 맞춤형 노트, 핵심 정의, 예시, 맥락을 확장해 제공합니다.
Chapter 2: Functions and Graphs
2.1 Basics of Functions and Their Graphs
This section introduces the foundational concepts of functions, their graphical representations, and how to analyze them. Understanding these basics is essential for further study in algebra and calculus.
Definition of a Relation
Relation: A correspondence between two sets, often represented as a set of ordered pairs (x, y).
Domain: The set of all first components (x-values) of the ordered pairs.
Range: The set of all second components (y-values) of the ordered pairs.
Example: Find the domain and range of the relation: {(0, 9.1), (10, 6.7), (20, 10.7), (30, 13.2), (40, 21.2)}. Solution: Domain: {0, 10, 20, 30, 40}; Range: {9.1, 6.7, 10.7, 13.2, 21.2}
Definition of a Function
Function: A relation from a set called the domain to a set called the range, such that each element in the domain corresponds to exactly one element in the range.
Example: Is the relation {(1, 2), (3, 4), (6, 5), (8, 5)} a function? Solution: Yes, because no two ordered pairs have the same first component with different second components.
Functions as Equations
If an equation is solved for y and more than one value of y can be obtained for a given x, then the equation does not define y as a function of x.
Example: If for some x, an equation yields two different y-values, it is not a function.
Function Notation
The notation f(x) represents the value of the function f at the number x. It is read as "f of x" or "f at x".
Example: If f(x) = 2x + 3, then f(2) = 2(2) + 3 = 7.
Evaluating a Function
To evaluate a function, substitute the given value into the function's formula.
Example: If f(x) = x^2, then f(3) = 3^2 = 9.
Graphs of Functions
The graph of a function consists of all ordered pairs (x, f(x)).
To graph a function, plot points for several values of x and connect them smoothly.
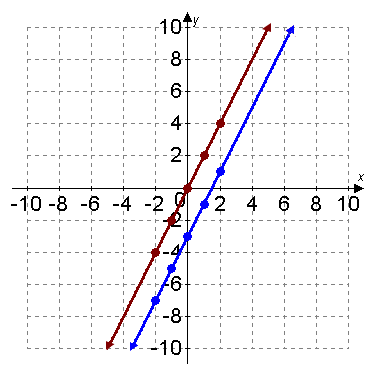
Example: Graph the functions f(x) = 2x and g(x) = 2x – 3 for x from –2 to 2.
The Vertical Line Test for Functions
If any vertical line intersects a graph in more than one point, the graph does not define y as a function of x.
Example: Use the vertical line test to determine if a graph represents a function.
Obtaining Information from a Function's Graph
To find f(a), locate x = a on the x-axis and find the corresponding y-value on the graph.
To solve f(x) = b, find the x-value(s) where the graph reaches y = b.
Example: If f(5) = 400, then at x = 5, the graph passes through (5, 400). If f(x) = 100 at x = 9, then the graph passes through (9, 100).
Identifying Domain and Range from a Function’s Graph
Domain: All x-values for which the graph has points.
Range: All y-values that the graph attains.
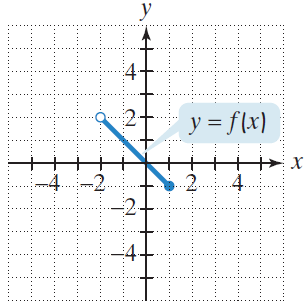
Example: Use the graph to identify the domain and range of a function.
Identifying Intercepts from a Function’s Graph
x-intercepts: Points where the graph crosses the x-axis (y = 0).
y-intercept: Point where the graph crosses the y-axis (x = 0). A function can have more than one x-intercept but at most one y-intercept.
Example: For the graph of f(x), the x-intercepts are (–3, 0), (–1, 0), and (2, 0). The y-intercept is (0, –6).
