 뒤로
뒤로Functions and Their Properties: A College Algebra Study Guide
스터디 가이드 - 스마트 노트
 자료에 맞춘 맞춤형 노트, 핵심 정의, 예시, 맥락을 확장해 제공합니다.
Functions and Function Notation
Definition of a Function
A function is a relation between two sets where each input value (from the domain) is assigned to exactly one output value (from the range). Functions are fundamental objects in algebra and are used to model relationships between quantities.
Input values are called the domain.
Output values are called the range.
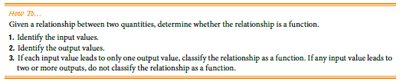
How to determine if a relationship is a function:
Identify the input values.
Identify the output values.
If each input value leads to only one output value, the relationship is a function. If any input value leads to two or more outputs, it is not a function.
Vertical Line Test
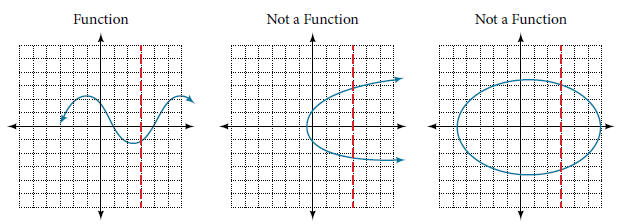
The vertical line test is a graphical method to determine if a curve represents a function. If any vertical line intersects the graph more than once, the graph does not represent a function.
Inspect the graph to see if any vertical line would intersect the curve more than once.
If so, the graph does not represent a function.

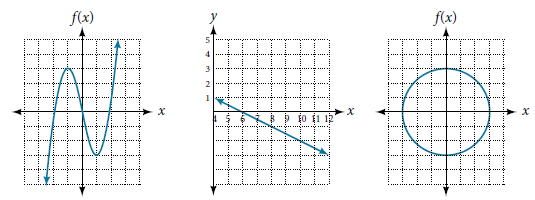
Examples: Identifying Functions from Graphs
The first graph passes the vertical line test and is a function.
The second and third graphs fail the test and are not functions.
Examples: Identifying Functions from Tables
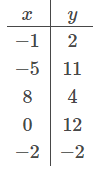
Tables can also be used to determine if a relation is a function. Each input value should correspond to only one output value.
x | y |
|---|---|
-1 | 2 |
-5 | 11 |
8 | 4 |
0 | 12 |
-2 | -2 |
One-to-One Functions and the Horizontal Line Test
Definition of One-to-One Function
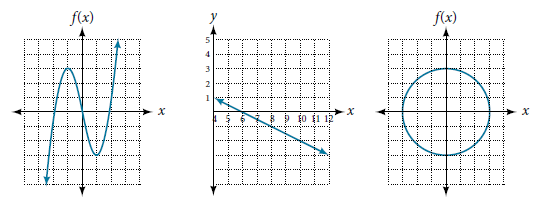
A function is one-to-one if each output value is paired with exactly one input value. This means no horizontal line intersects the graph more than once.
One-to-one functions have unique outputs for unique inputs and vice versa.
Horizontal Line Test:
Inspect the graph to see if any horizontal line would intersect the curve more than once.
If so, the function is not one-to-one.

Piecewise Functions
Definition and Notation
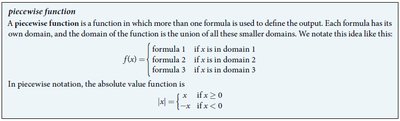
A piecewise function is defined by different formulas on different parts of its domain. Each formula applies to a specific interval of the input values.
Piecewise notation allows us to describe functions that behave differently in different intervals.
For example, the absolute value function can be written as:
Behavior of Graphs: Increasing, Decreasing, and Constant
Intervals of Increase and Decrease
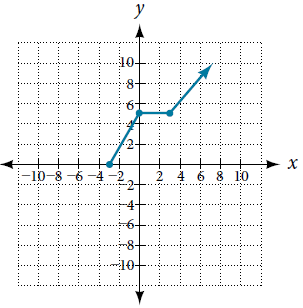
A function can be classified as increasing, decreasing, or constant over specific intervals:
Increasing: for
Decreasing: for
Constant: for
Local Minima and Maxima
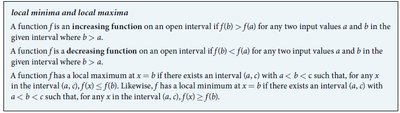
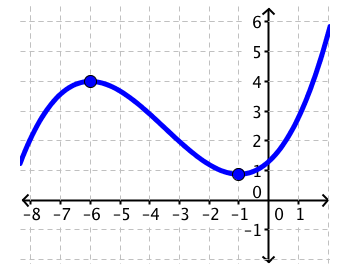
Local minimum is the lowest point in a small interval, and local maximum is the highest point in a small interval. These points are important for analyzing the behavior of functions.
Operations and Composition of Functions
Operations with Functions
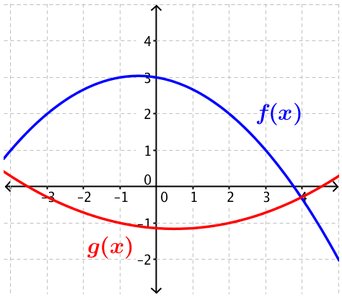
Functions can be added, subtracted, multiplied, or divided:
, where
Composition of Functions
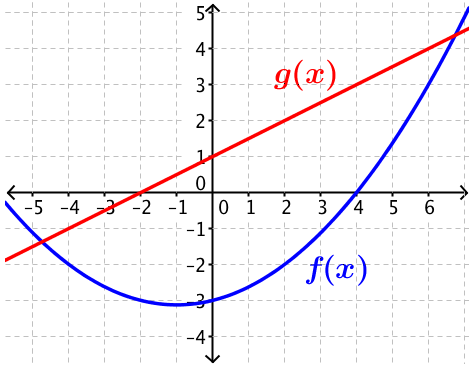
The composition of functions is when the output of one function becomes the input of another. It is denoted as .
The domain of is all such that $x$ is in the domain of and is in the domain of .
Function composition is not the same as multiplication: in general.
Examples: Evaluating Composite Functions from Tables
x | f(x) | g(x) |
|---|---|---|
1 | 4 | 12 |
2 | 3 | 10 |
3 | 1 | 5 |
4 | 2 | 14 |
The Difference Quotient
Definition
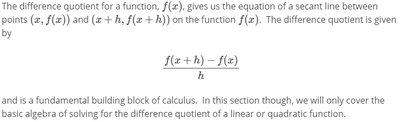
The difference quotient for a function is a formula that gives the average rate of change of the function over an interval of length :
This concept is foundational for calculus, as it leads to the definition of the derivative.
Transformations of Functions
Vertical Shifts
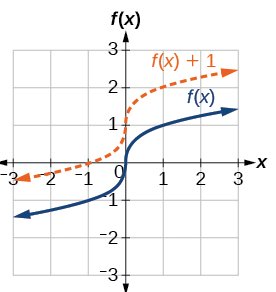
A vertical shift moves the graph of a function up or down. If , the graph shifts up by units if and down by $k$ units if .

Horizontal Shifts
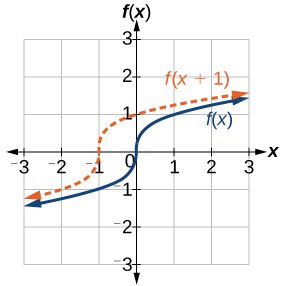
A horizontal shift moves the graph left or right. If , the graph shifts right by units if and left by .
Reflections
A vertical reflection is given by , reflecting the graph over the x-axis. A horizontal reflection is given by , reflecting the graph over the y-axis.
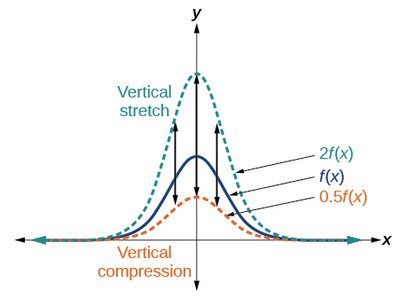
Vertical Stretches and Compressions
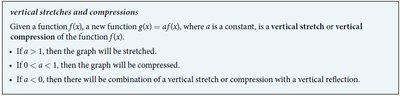
If , where is a constant:
If , the graph is stretched vertically.
If , the graph is compressed vertically.
If , there is a combination of vertical stretch/compression and reflection.
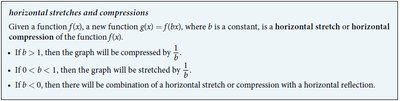
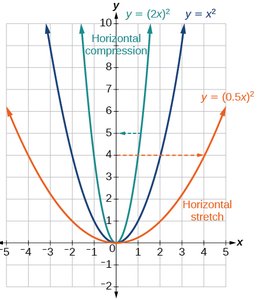
Horizontal Stretches and Compressions
If , where is a constant:
If , the graph is compressed horizontally by .
If , the graph is stretched horizontally by .
If , there is a combination of horizontal stretch/compression and reflection.
Even and Odd Functions
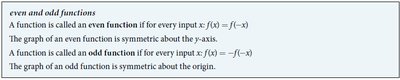
Definitions
A function is even if for all in the domain. The graph is symmetric about the y-axis.
A function is odd if for all in the domain. The graph is symmetric about the origin.
How to Determine Even, Odd, or Neither
Check if (even).
Check if (odd).
If neither, the function is neither even nor odd.

Summary Table: Key Properties of Functions
Property | Test | Graphical Interpretation |
|---|---|---|
Function | Vertical Line Test | Each x-value has one y-value |
One-to-One | Horizontal Line Test | Each y-value has one x-value |
Even | Symmetric about y-axis | |
Odd | Symmetric about origin |
Additional info: This guide covers the foundational concepts of functions, including their definitions, graphical tests, operations, composition, and transformations, as well as the classification of even and odd functions. These topics are essential for success in College Algebra and provide the groundwork for further study in mathematics.
