 뒤로
뒤로Graphing Linear Equations and Understanding Intercepts
스터디 가이드 - 스마트 노트
 자료에 맞춘 맞춤형 노트, 핵심 정의, 예시, 맥락을 확장해 제공합니다.
Graphing Linear Equations
Introduction to Linear Equations
Linear equations are fundamental in algebra and are characterized by their graphs, which are always straight lines. The general forms of linear equations include y = mx + b, Ax + By = C, x = a, and y = b. Each form provides a different method for graphing and analyzing the equation.
Linear Equations in Slope-Intercept Form
The slope-intercept form, y = mx + b, is widely used for graphing lines. Here, m represents the slope, and b is the y-intercept.
Slope (m): Indicates the steepness and direction of the line.
Y-intercept (b): The point where the line crosses the y-axis, given by (0, b).
Graphing: Start at the y-intercept and use the slope to find additional points.
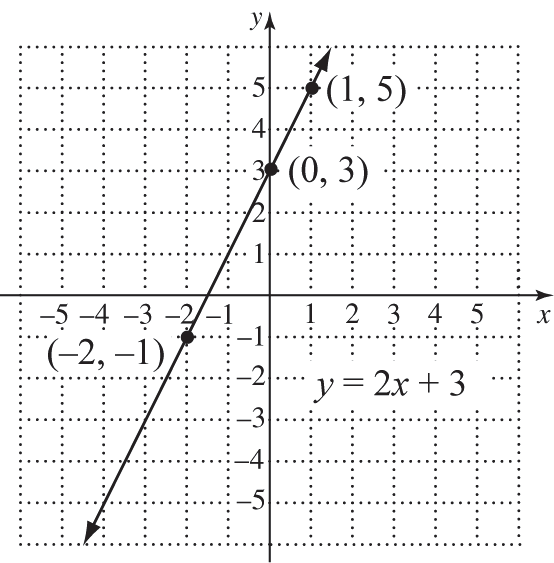
Example: For y = 2x + 3, the slope is 2 and the y-intercept is 3.
Example Points: (0, 3), (1, 5), (-2, -1)
Linear Equations with Negative Slope
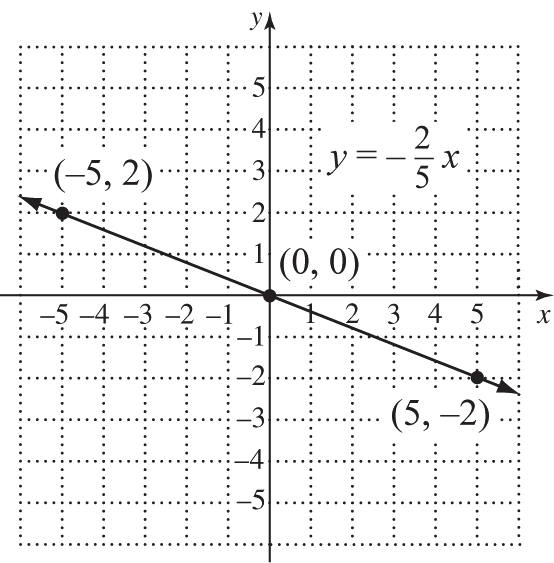
When the slope is negative, the line decreases as x increases. The equation y = -\frac{2}{5}x passes through the origin and has a negative slope.
Example Points: (0, 0), (5, -2), (-5, 2)
Linear Equations in Standard Form
Equations in the form Ax + By = C can be converted to slope-intercept form or graphed using intercepts.
Finding Intercepts: Set x = 0 to find the y-intercept; set y = 0 to find the x-intercept.
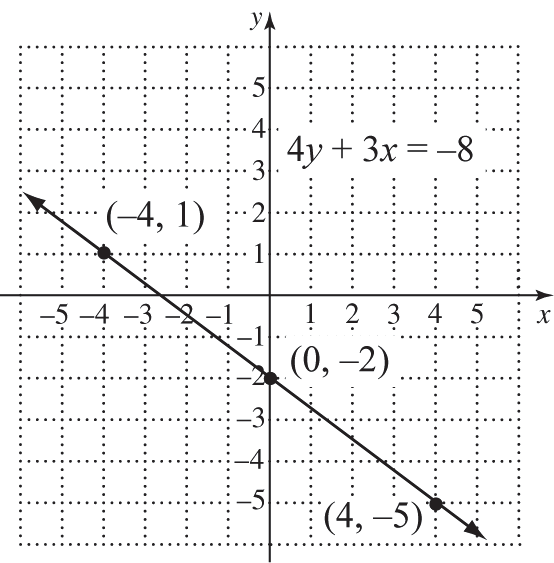
Example: For 4y + 3x = -8, solve for y to get y = -\frac{3}{4}x - 2.
Example Points: (0, -2), (4, -5), (-4, 1)
Intercepts of a Line
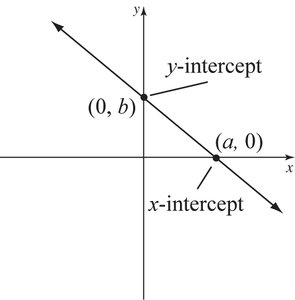
Intercepts are key features of linear equations:
Y-intercept: The point (0, b) where the line crosses the y-axis.
X-intercept: The point (a, 0) where the line crosses the x-axis.
Graphing Using Intercepts
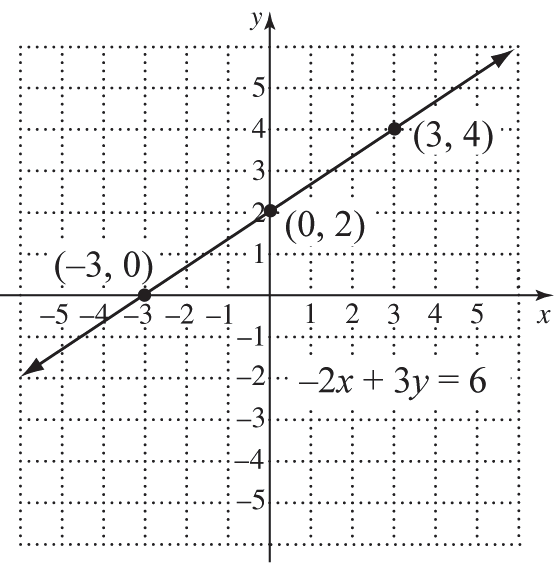
For equations where the coefficients are factors of the constant, graphing by intercepts is efficient. For example, -2x + 3y = 6:
Y-intercept: Set x = 0, y = 2
X-intercept: Set y = 0, x = -3
Additional Point: (3, 4)
Horizontal and Vertical Lines
Special cases of linear equations include horizontal and vertical lines:
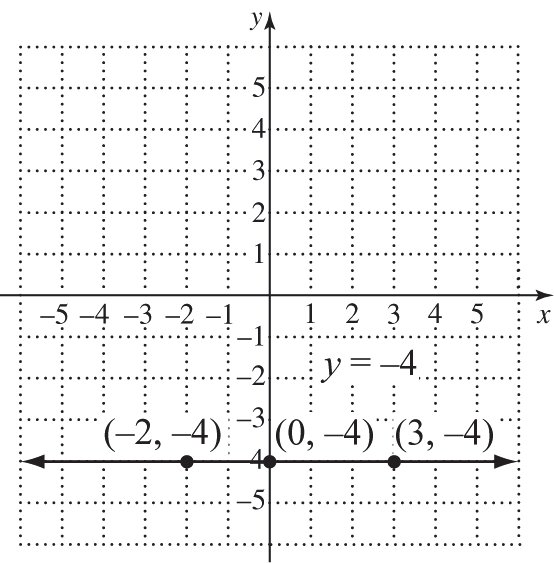
Horizontal Line: y = b is a line parallel to the x-axis at y = b.
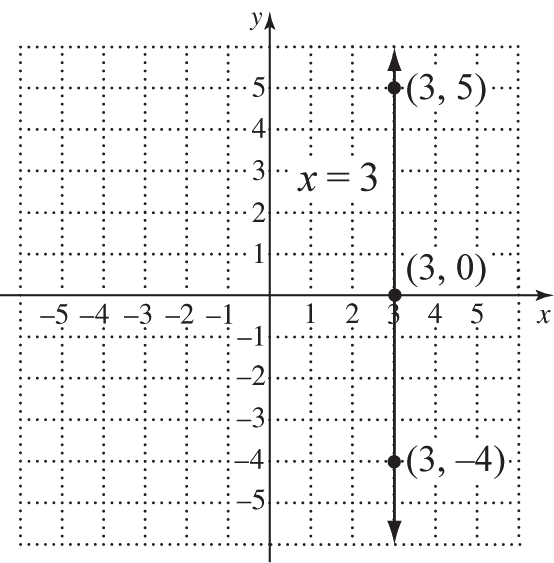
Vertical Line: x = a is a line parallel to the y-axis at x = a.
Example: y = -4 is a horizontal line through y = -4; x = 3 is a vertical line through x = 3.
Summary Table: Forms of Linear Equations
Form | Graph Type | Key Features |
|---|---|---|
y = mx + b | Straight line | Slope m, y-intercept b |
Ax + By = C | Straight line | Can use intercepts or convert to y = mx + b |
x = a | Vertical line | x-intercept at (a, 0) |
y = b | Horizontal line | y-intercept at (0, b) |
Key Concepts and Applications
Linear equations are used to model relationships with constant rates of change.
Intercepts provide quick reference points for graphing.
Slope determines the direction and steepness of the line.
Horizontal and vertical lines represent special cases with undefined or zero slope.
Example Application: In economics, linear equations can model cost functions, where the slope represents the rate of change in cost per unit.
