 뒤로
뒤로Graphing Solution Sets for Systems of Inequalities
스터디 가이드 - 스마트 노트
 자료에 맞춘 맞춤형 노트, 핵심 정의, 예시, 맥락을 확장해 제공합니다.
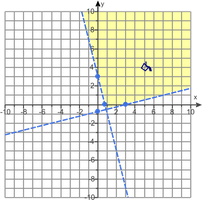
Q1. Graph the solution set of the system of inequalities:
Background
Topic: Systems of Linear Inequalities and Graphing
This question tests your ability to graph linear inequalities and identify the region that satisfies all inequalities in the system. The solution set is the region where the shaded areas of all inequalities overlap.
Key Terms and Formulas:
Linear Inequality: An inequality that involves a linear function, such as .
Solution Set: The set of all points that satisfy all inequalities in the system.
Graphing: To graph an inequality, first graph the boundary line (solid for or , dashed for or ), then shade the region that satisfies the inequality.
Step-by-Step Guidance
Rewrite each inequality in slope-intercept form () to make graphing easier. - For , solve for . - For , solve for .
Graph the boundary lines for each inequality on the coordinate plane. - Use a dashed line for both since the inequalities are strict ( and ).
Determine which side of each line to shade. - For , test a point (like ) to see if it satisfies the inequality. - For , do the same.
The solution set is the region where the shaded areas for both inequalities overlap.
Check the vertices of the overlapping region, as these are often useful for further analysis or optimization problems.
Try solving on your own before revealing the answer!
Final Answer:
The solution set is the yellow-shaded region shown in the graph, which represents all points that satisfy both and . The boundaries are dashed, indicating that points on the lines themselves are not included in the solution set.
To find the exact vertices of the region, solve the equations and simultaneously, and check the intercepts with the axes as needed.
Q2. Graph the solution set of the following system of inequalities:
Background
Topic: Systems of Linear and Quadratic Inequalities
This question tests your ability to graph a system involving a linear and a quadratic inequality, and to identify the region that satisfies both.
Key Terms and Formulas:
Linear Inequality:
Quadratic Inequality:
Solution Set: The region where the shaded areas for both inequalities overlap.
Step-by-Step Guidance
Rewrite each inequality in -form if needed. - For , solve for .
Graph the boundary lines/curves for each inequality. - Use a solid line for or .
Shade the region that satisfies each inequality. - For , shade below or on the line. - For , shade above or on the parabola.
The solution set is the intersection (overlap) of the shaded regions.
Identify the vertices of the overlapping region for further analysis if needed.
Try solving on your own before revealing the answer!
Final Answer:
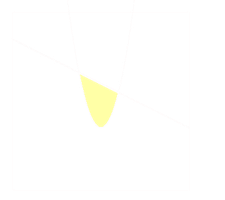
The solution set is the yellow-shaded region shown in the graph, which represents all points that satisfy both and . The boundaries are solid, indicating that points on the lines themselves are included in the solution set.
To find the exact vertices, solve the equations and simultaneously, and check the intercepts as needed.
