 뒤로
뒤로Graphs and Graphing Utilities in College Algebra
스터디 가이드 - 스마트 노트
 자료에 맞춘 맞춤형 노트, 핵심 정의, 예시, 맥락을 확장해 제공합니다.
Equations and Inequalities
Graphs and Graphing Utilities
This section introduces the foundational concepts of the rectangular coordinate system, plotting points, graphing equations, and interpreting graphical information. Mastery of these topics is essential for understanding more advanced algebraic concepts and for using graphing utilities effectively.
The Rectangular Coordinate System
Definition: The rectangular coordinate system consists of two perpendicular number lines: the x-axis (horizontal) and the y-axis (vertical), which intersect at the origin (0, 0).
Positive and Negative Directions: Numbers to the right of the origin (on the x-axis) and above the origin (on the y-axis) are positive; numbers to the left and below are negative.
Ordered Pairs: Each point is represented by an ordered pair (x, y), where x is the horizontal distance from the origin and y is the vertical distance.
Plotting Points in the Rectangular Coordinate System
Procedure: To plot a point (x, y): move x units left/right from the origin, then y units up/down.
Example: To plot (–2, 4), move 2 units left and 4 units up. To plot (4, –2), move 4 units right and 2 units down.
Graphs of Equations
Definition: An equation in two variables (x and y) represents a relationship between x and y. The graph of the equation is the set of all points (x, y) that satisfy the equation.
Solution: An ordered pair (x, y) is a solution if substituting x and y into the equation yields a true statement.
Graphing an Equation Using the Point-Plotting Method
Steps:
Select integer values for x within a given range.
Calculate the corresponding y values using the equation.
Plot the resulting points (x, y) on the coordinate plane.
Connect the points to reveal the graph of the equation.
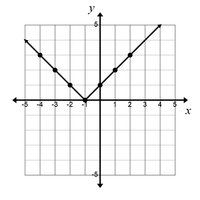
Example: For a given equation, select x-values from –4 to 2, compute y-values, plot the points, and connect them to form the graph.
Graphing Utilities
Definition: Graphing calculators and computer software that plot equations are called graphing utilities.
Viewing Rectangle: The viewing rectangle sets the minimum and maximum values for both axes. For example, [–10,10,1] by [–10,10,1] is the standard viewing rectangle, where the third number is the tick mark interval.
Example: A [–100,100,50] by [–100,100,10] rectangle means x and y range from –100 to 100, with tick marks every 50 units on x and every 10 units on y.
Intercepts
x-intercept: The x-coordinate where the graph crosses the x-axis (y = 0).
y-intercept: The y-coordinate where the graph crosses the y-axis (x = 0).
Example: If a graph crosses the x-axis at (–3, 0), the x-intercept is –3. If it crosses the y-axis at (0, 5), the y-intercept is 5.
Interpreting Information Given by Graphs
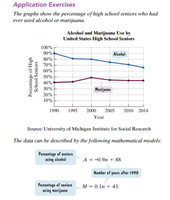
Application: Graphs can model real-world relationships, such as the percentage of marriages ending in divorce after a certain number of years.
Example: The equation models the percentage d of marriages ending in divorce after n years (when the wife is under 18 at marriage). To find the percentage after 15 years, substitute n = 15:
So, 65% of such marriages end in divorce after 15 years.
Verification: The point (15, 65) should appear on the graph of the equation, confirming the calculation.
Summary Table: Key Concepts in Graphing
Concept | Definition | Example |
|---|---|---|
Origin | Intersection of x- and y-axes (0, 0) | (0, 0) |
Ordered Pair | (x, y) location in the plane | (–2, 4) |
x-intercept | Where graph crosses x-axis (y = 0) | (–3, 0) |
y-intercept | Where graph crosses y-axis (x = 0) | (0, 5) |
Viewing Rectangle | Graphing window for x and y values | [–10,10,1] by [–10,10,1] |
