 뒤로
뒤로Step-by-Step Guidance for Selected College Algebra Practice Questions
스터디 가이드 - 스마트 노트
 자료에 맞춘 맞춤형 노트, 핵심 정의, 예시, 맥락을 확장해 제공합니다.
Q2. Algebra Tiles Representation
Background
Topic: Algebraic Expressions and Visual Models
This question tests your ability to interpret algebra tiles and connect them to algebraic expressions. Algebra tiles are a visual tool to help understand variables and constants in expressions.
Key Terms and Formulas
Algebra tile: A rectangular tile represents a variable (e.g., x), and a small square represents a constant (e.g., 1).
Expression: A combination of variables, numbers, and operations.
Step-by-Step Guidance
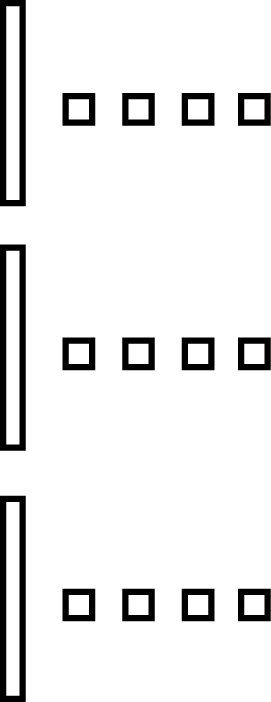
Count the number of rods (representing x) and small squares (representing 1) in the diagram.
Write an expression that combines the total number of x's and 1's.
Compare your expression to the answer choices to see which matches the visual model.
Try solving on your own before revealing the answer!
Final Answer: A. 3x + 4
The diagram shows 3 rods (x) and 4 small squares (1), so the expression is 3x + 4.
Q5. Contribution of Y in Multiplication
Background
Topic: Place Value and Multiplication
This question tests your understanding of how each digit in a multi-digit multiplication problem contributes to the total product, especially when a variable is involved.
Key Terms and Formulas
Place value: The value of a digit depending on its position in a number.
Multiplication: Each digit in the top number is multiplied by each digit in the bottom number, considering place value.
Step-by-Step Guidance
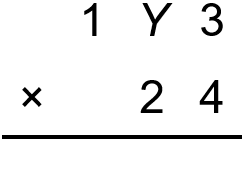
Identify the place value of Y in the number 1Y3 (hundreds, tens, or ones).
Multiply Y by the number 24, considering its place value in the original number.
Write the expression that represents Y's total contribution to the product.
Try solving on your own before revealing the answer!
Final Answer: B. 24 • Y
Y is in the tens place, so its value is 10Y. When multiplied by 24, the contribution is 24Y.
Q10. Algebra Tiles and Properties of Operations
Background
Topic: Properties of Operations (Additive Identity, Associative, Commutative, Inverse)
This question asks you to identify which property justifies a step in a visual demonstration using algebra tiles.
Key Terms and Formulas
Additive identity property: Adding 0 to a number does not change its value.
Associative property: The grouping of numbers does not affect their sum or product.
Commutative property: The order of numbers does not affect their sum or product.
Multiplicative inverse property: The product of a number and its reciprocal is 1.
Step-by-Step Guidance
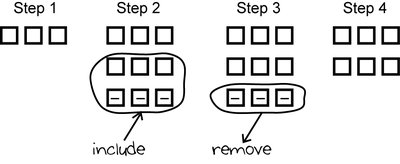
Observe what is being added or removed in Step 2 of the algebra tiles demonstration.
Consider which property allows you to add or remove pairs of opposite tiles (positive and negative) without changing the value.
Match this action to the correct property from the answer choices.
Try solving on your own before revealing the answer!
Final Answer: A. Additive identity property
Step 2 uses the additive identity property by adding zero pairs (positive and negative tiles) to the model.
Q31. Area of the Base of a Monument
Background
Topic: Area of Rectangles and Algebraic Expressions
This question involves expressing the area of a rectangle (the base of a monument) in terms of a variable, given the total dimensions and the width of the surrounding path.
Key Terms and Formulas
Area of a rectangle:
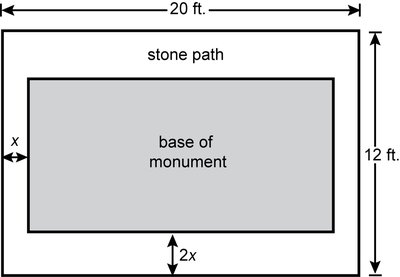
Variable: x represents the width of the path on the shorter side; 2x on the longer side.
Step-by-Step Guidance
Subtract the widths of the paths from the total dimensions to find the dimensions of the base of the monument.
Write expressions for the length and width of the base in terms of x.
Multiply these expressions to get the area of the base as a quadratic expression in x.
Try solving on your own before revealing the answer!
Final Answer: D. 8(x^2 - 13x + 30)
The base has dimensions (20 - 2x) and (12 - 4x), so the area is (20 - 2x)(12 - 4x) = 8(x^2 - 13x + 30).
Q34. Graphing the Solution Set for an Inequality
Background
Topic: Graphing Linear Inequalities
This question tests your ability to interpret and graph the solution set for a linear inequality on a number line.
Key Terms and Formulas
Inequality: A mathematical statement that compares two expressions using symbols like <, >, ≤, or ≥.
Open circle: Used on a number line to indicate that a value is not included in the solution set.




Step-by-Step Guidance
Solve the inequality for the variable to determine the solution set.
Identify whether the solution includes or excludes the endpoint (open or closed circle).
Match the correct number line graph to the solution set you found.
Try solving on your own before revealing the answer!
Final Answer: A. (Image 5)
The correct graph shows an open circle at -1/3 and shading to the left, representing all values less than -1/3.
Q36. Interpreting Graphs of Cans
Background
Topic: Data Interpretation and Graph Analysis
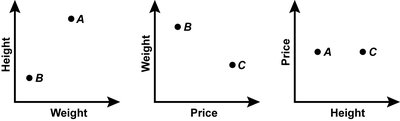
This question asks you to interpret scatter plots comparing height, weight, and price of three soup cans.
Key Terms and Formulas
Scatter plot: A graph with points plotted to show a possible relationship between two sets of data.
Axes: Each graph compares two variables (e.g., height vs. weight).
Step-by-Step Guidance
Examine each graph to see how the cans compare on each pair of variables.
Look for the can that is highest or lowest on each axis, depending on the question.
Match the correct statement to the information shown in the graphs.
Try solving on your own before revealing the answer!
Final Answer: D. Can A is the tallest.
In the height vs. weight graph, Can A is plotted higher than the others, indicating it is the tallest.
Q37. Water Height vs. Time in a Cylindrical Container
Background
Topic: Interpreting Graphs of Physical Situations
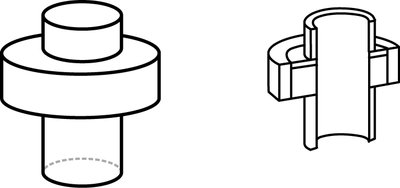
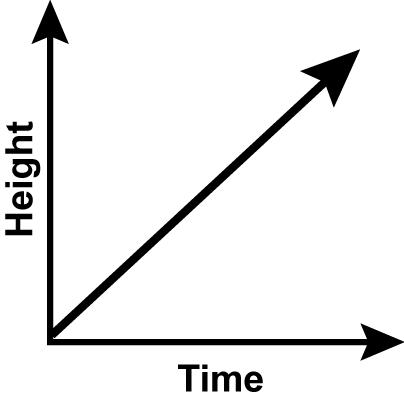
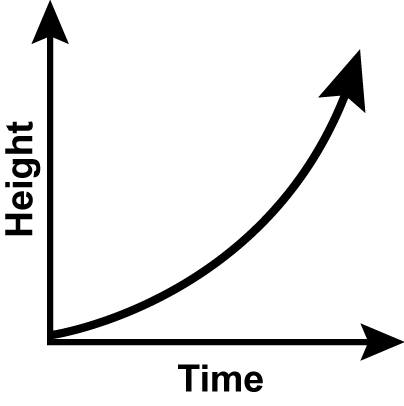
This question tests your ability to match a real-world scenario (filling a container with water) to the correct graph of height versus time.
Key Terms and Formulas
Rate: The speed at which water is poured is constant.
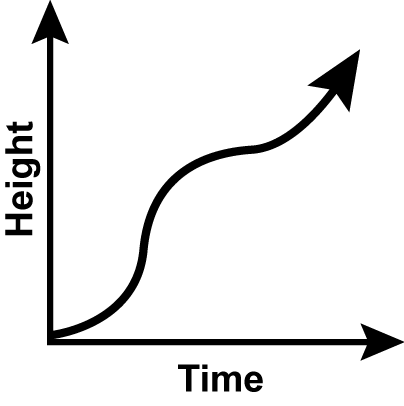
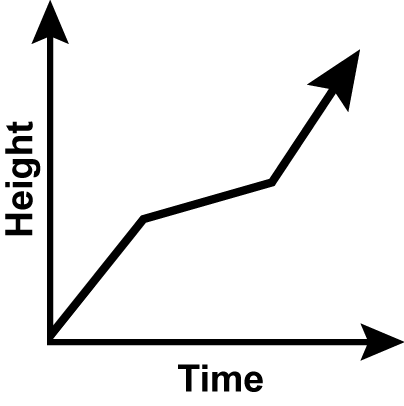
Height vs. time graph: The shape of the graph depends on the cross-sectional area of the container at different heights.
Step-by-Step Guidance
Consider how the height of water changes as it fills each section of the container.
Think about whether the height increases at a constant rate or changes as the cross-sectional area changes.
Match the scenario to the graph that best represents the changing rate of height increase.
Try solving on your own before revealing the answer!
Final Answer: C. (Image 13)
The S-shaped graph best represents the changing rate as water fills sections of different areas.
