Ch. 1 - Equations and Inequalities
Blitzer - College Algebra 8th Edition
Blitzer8th EditionCollege AlgebraISBN: 9780136970514당신이 사용하는 게 아니라요?교과서 변경
2장, 문제 20a

Graph each equation in Exercises 13 - 28. Let x = - 3, - 2, - 1, 0, 1, 2, 3
y = - (1/2)x + 2

검증된 단계별 안내
1
Step 1: Understand the equation y = -(1/2)x + 2. This is a linear equation in slope-intercept form, y = mx + b, where m is the slope and b is the y-intercept. Here, the slope m = -(1/2) and the y-intercept b = 2.
Step 2: Create a table of values for x and y. Substitute the given x-values (-3, -2, -1, 0, 1, 2, 3) into the equation y = -(1/2)x + 2 to calculate the corresponding y-values. For example, when x = -3, substitute into the equation to find y.
Step 3: Plot the points (x, y) on a Cartesian coordinate system. Use the x-values and their corresponding y-values from the table to mark the points on the graph.
Step 4: Draw the line through the plotted points. Since this is a linear equation, the points will align in a straight line. Extend the line in both directions, ensuring it passes through all the points.
Step 5: Label the graph. Indicate the slope of the line (-1/2) and the y-intercept (2). Ensure the axes are labeled correctly and the scale is consistent.

비슷한 문제에 대한 검증된 영상 답변:

이 영상 해법은 위 문제에 도움이 된다고 튜터들이 추천한 것입니다.
영상 길이:
1m
도움이 되었나요?

주요 개념

질문에 올바르게 답하기 위해 반드시 이해해야 하는 핵심 개념들은 다음과 같습니다.

Linear Equations

A linear equation is an algebraic expression that represents a straight line when graphed on a coordinate plane. It typically takes the form y = mx + b, where m is the slope and b is the y-intercept. Understanding linear equations is essential for graphing, as it allows students to identify how changes in x affect y.
추천 영상:
06:00
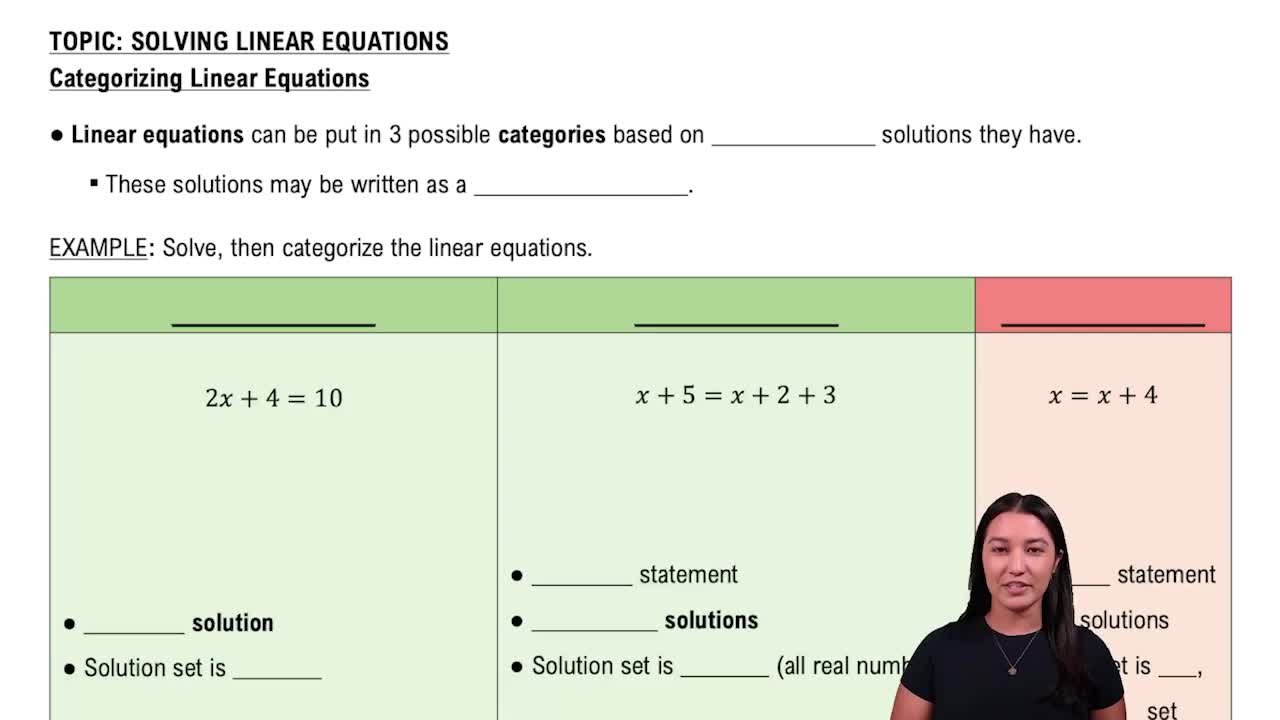
Categorizing Linear Equations

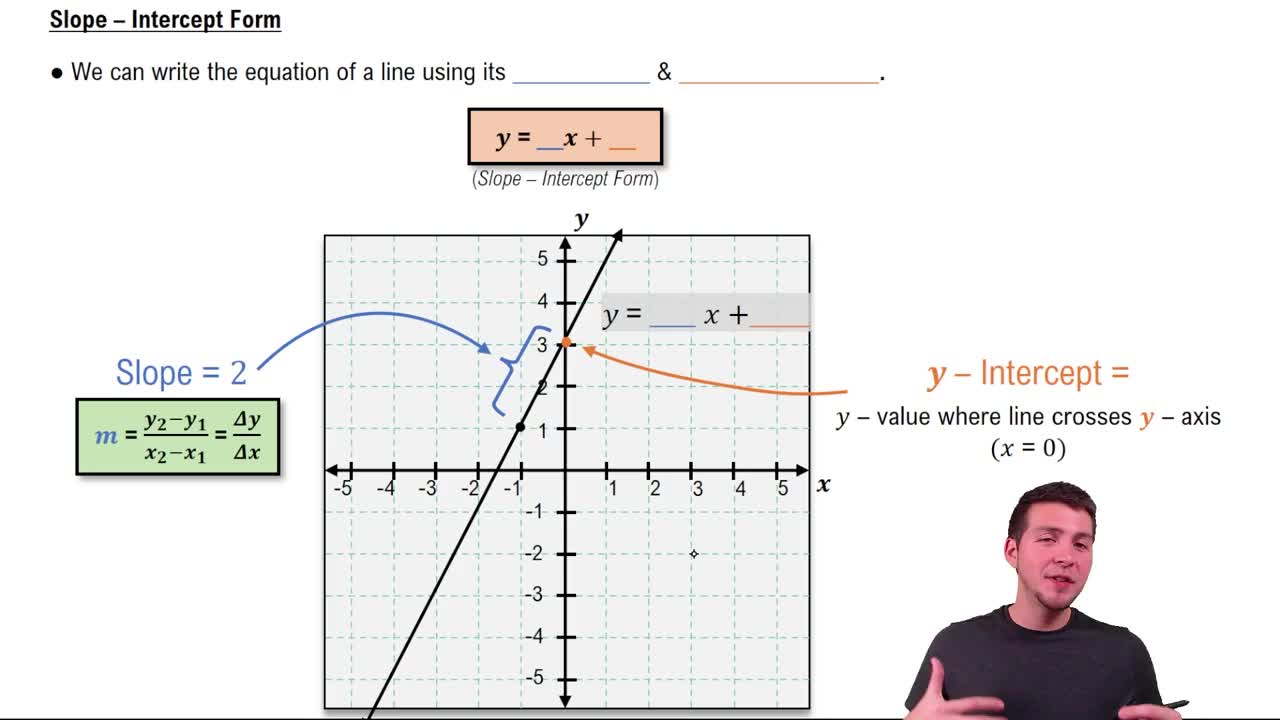
Slope-Intercept Form

The slope-intercept form of a linear equation is expressed as y = mx + b, where m represents the slope of the line and b represents the y-intercept. The slope indicates the steepness and direction of the line, while the y-intercept is the point where the line crosses the y-axis. This form is particularly useful for quickly identifying key characteristics of the graph.
추천 영상:
03:56
Slope-Intercept Form

Graphing Points

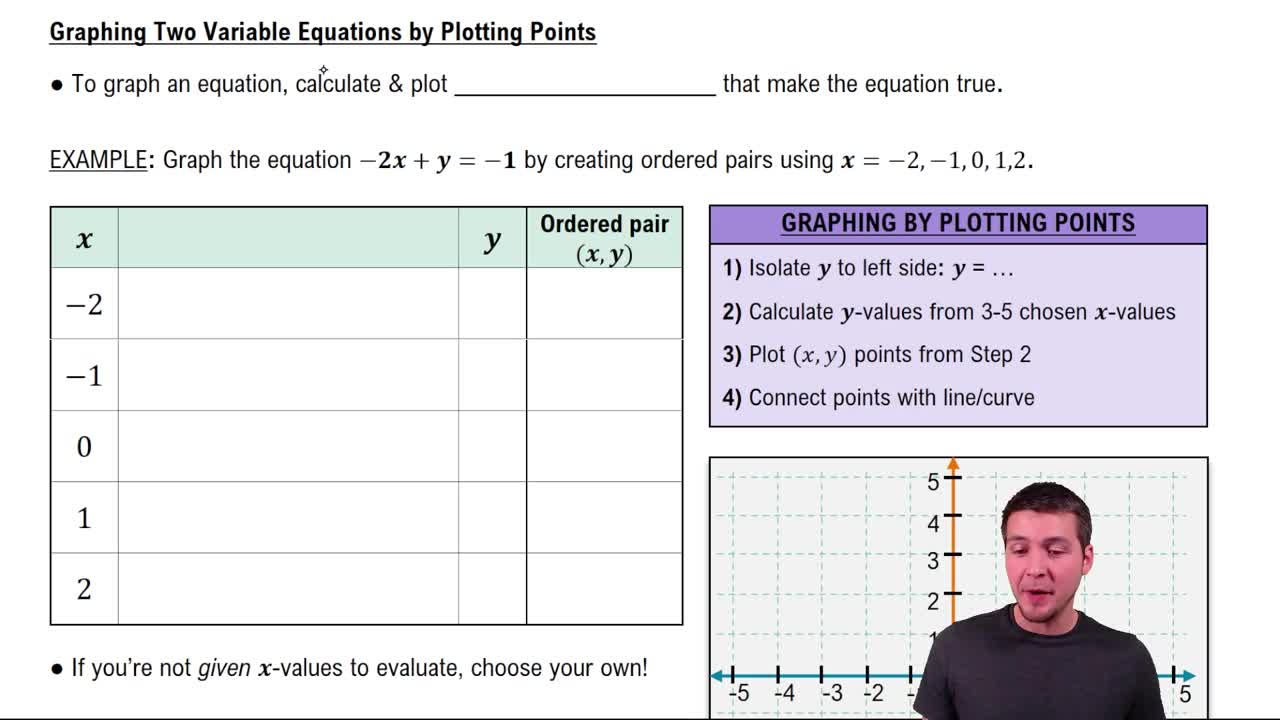
Graphing points involves plotting specific (x, y) coordinates on a Cartesian plane. For the given equation, substituting values of x allows us to calculate corresponding y values, creating a set of points that can be plotted. Understanding how to graph points is crucial for visualizing the relationship between variables in linear equations.
추천 영상:
04:29
Graphing Equations of Two Variables by Plotting Points