뒤로
뒤로
문제 1
In Exercises 1–10, approximate each number using a calculator. Round your answer to three decimal places. 23.4
문제 3
In Exercises 1–10, approximate each number using a calculator. Round your answer to three decimal places. 3√5
문제 5
In Exercises 1–10, approximate each number using a calculator. Round your answer to three decimal places. 4-1.5
문제 7
In Exercises 1–10, approximate each number using a calculator. Round your answer to three decimal places. e2.3
문제 9
In Exercises 1–10, approximate each number using a calculator. Round your answer to three decimal places. e-0.95
문제 11
In Exercises 11–18, graph each function by making a table of coordinates. If applicable, use a graphing utility to confirm your hand-drawn graph. f(x) = 4x
문제 13
Graph each function by making a table of coordinates. If applicable, use a graphing utility to confirm your hand-drawn graph. g(x) = (3/2)x
문제 15
Graph each function by making a table of coordinates. If applicable, use a graphing utility to confirm your hand-drawn graph. h(x) = (1/2)x
문제 17
Graph each function by making a table of coordinates. If applicable, use a graphing utility to confirm your hand-drawn graph. f(x) = (0.6)x
문제 19
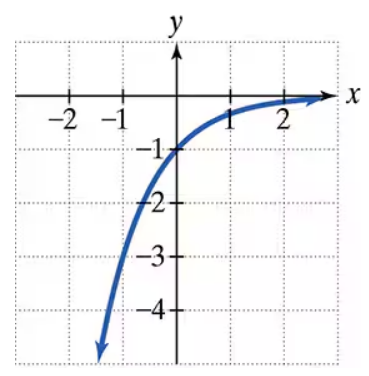
In Exercises 19–24, the graph of an exponential function is given. Select the function for each graph from the following options:
문제 21
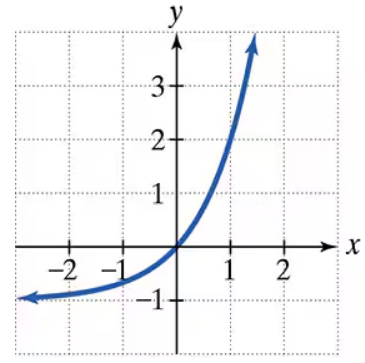
The graph of an exponential function is given. Select the function for each graph from the following options:
문제 23
The graph of an exponential function is given. Select the function for each graph from the following options:
문제 25
Begin by graphing f(x) = 2x. Then use transformations of this graph to graph the given function. Be sure to graph and give equations of the asymptotes. Use the graphs to determine each function's domain and range. If applicable, use a graphing utility to confirm your hand-drawn graphs. g(x) = 2x+1
문제 27
Begin by graphing f(x) = 2x. Then use transformations of this graph to graph the given function. Be sure to graph and give equations of the asymptotes. Use the graphs to determine each function's domain and range. If applicable, use a graphing utility to confirm your hand-drawn graphs. g(x) = 2x – 1
문제 29
Begin by graphing f(x) = 2x. Then use transformations of this graph to graph the given function. Be sure to graph and give equations of the asymptotes. Use the graphs to determine each function's domain and range. If applicable, use a graphing utility to confirm your hand-drawn graphs. h(x) = 2x+1 – 1
문제 31
Begin by graphing f(x) = 2x. Then use transformations of this graph to graph the given function. Be sure to graph and give equations of the asymptotes. Use the graphs to determine each function's domain and range. If applicable, use a graphing utility to confirm your hand-drawn graphs. g(x) = −2x
문제 33
Begin by graphing f(x) = 2x. Then use transformations of this graph to graph the given function. Be sure to graph and give equations of the asymptotes. Use the graphs to determine each function's domain and range. If applicable, use a graphing utility to confirm your hand-drawn graphs. g(x) = 2.2x
문제 35
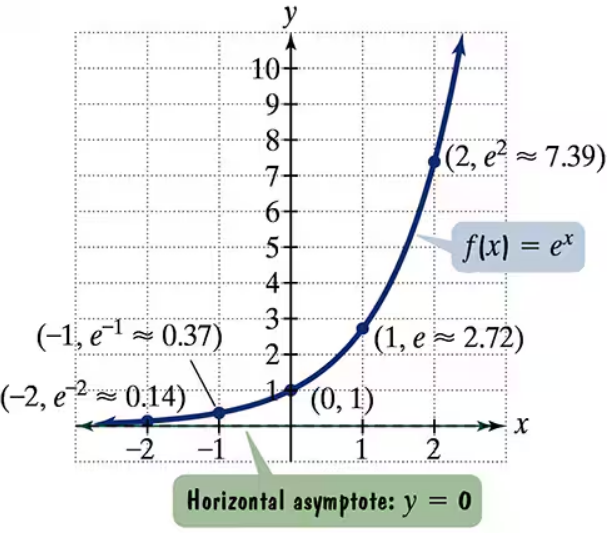
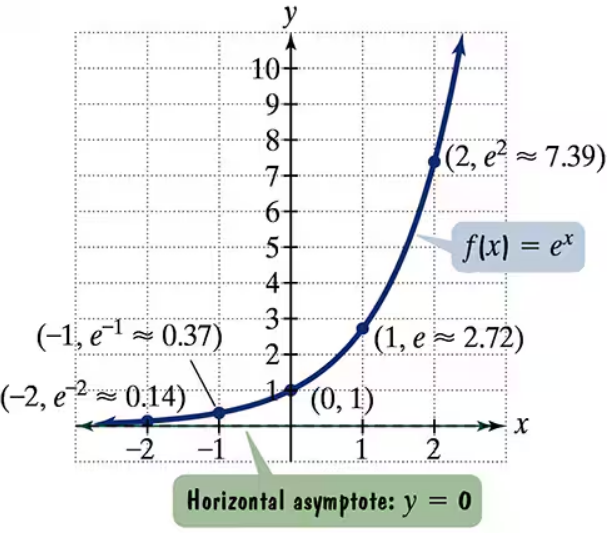
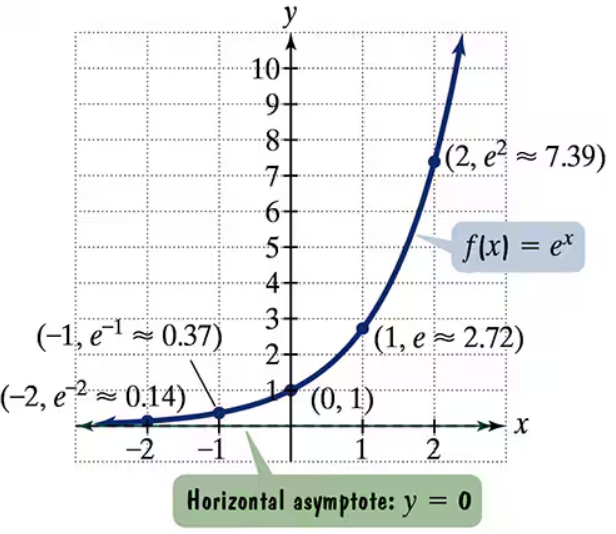
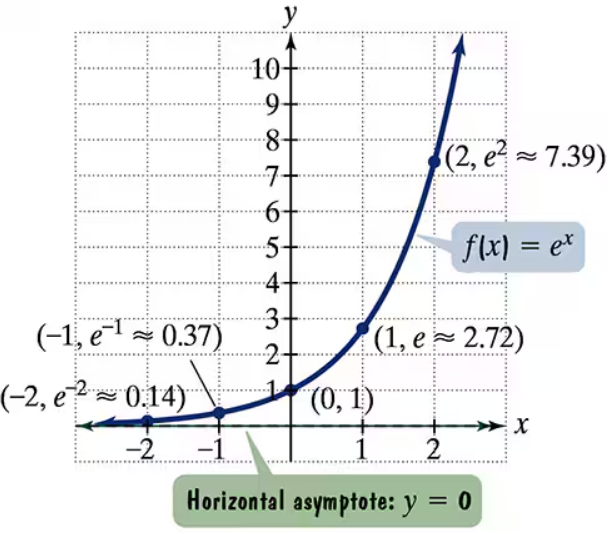
The figure shows the graph of f(x) = ex. In Exercises 35-46, use transformations of this graph to graph each function. Be sure to give equations of the asymptotes. Use the graphs to determine graphs. each function's domain and range. If applicable, use a graphing utility to confirm your hand-drawn g(x) = ex-1
문제 37
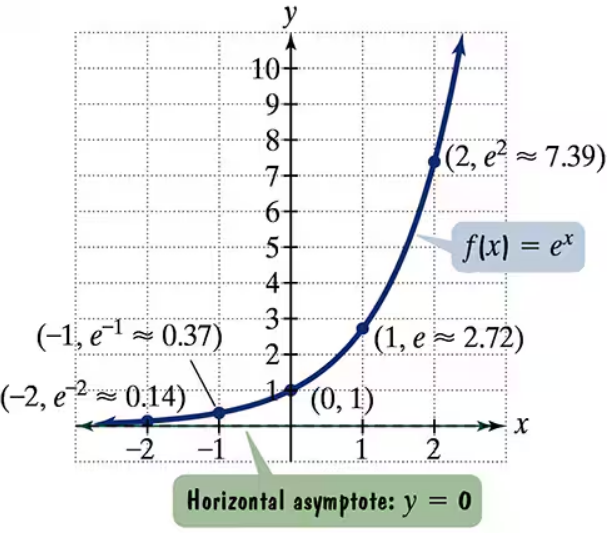
The figure shows the graph of f(x) = ex. In Exercises 35-46, use transformations of this graph to graph each function. Be sure to give equations of the asymptotes. Use the graphs to determine graphs. each function's domain and range. If applicable, use a graphing utility to confirm your hand-drawn g(x) = ex+2
문제 39
The figure shows the graph of f(x) = ex. In Exercises 35-46, use transformations of this graph to graph each function. Be sure to give equations of the asymptotes. Use the graphs to determine graphs. each function's domain and range. If applicable, use a graphing utility to confirm your hand-drawn h(x) = ex-1+2
문제 41
The figure shows the graph of f(x) = ex. In Exercises 35-46, use transformations of this graph to graph each function. Be sure to give equations of the asymptotes. Use the graphs to determine graphs. each function's domain and range. If applicable, use a graphing utility to confirm your hand-drawn h(x) = e-x
문제 43
The figure shows the graph of f(x) = ex. In Exercises 35-46, use transformations of this graph to graph each function. Be sure to give equations of the asymptotes. Use the graphs to determine graphs. each function's domain and range. If applicable, use a graphing utility to confirm your hand-drawn g(x) = 2ex
문제 45
The figure shows the graph of f(x) = ex. In Exercises 35-46, use transformations of this graph to graph each function. Be sure to give equations of the asymptotes. Use the graphs to determine graphs. each function's domain and range. If applicable, use a graphing utility to confirm your hand-drawn h(x) = e2x + 1
문제 47
Graph functions f and g in the same rectangular coordinate system. Graph and give equations of all asymptotes. If applicable, use a graphing utility to confirm your hand-drawn graphs. f(x) = 3x and g(x) = 3-x
문제 49
Graph functions f and g in the same rectangular coordinate system. Graph and give equations of all asymptotes. If applicable, use a graphing utility to confirm your hand-drawn graphs. f(x) = 3x and g(x) = (1/3). 3x
문제 51
Graph functions f and g in the same rectangular coordinate system. Graph and give equations of all asymptotes. If applicable, use a graphing utility to confirm your hand-drawn graphs. f(x) = (½)x and g(x) = (½)x-1 + 1
문제 55
Use the compound interest formulas A = P (1+ r/n)nt and A =Pert to solve exercises 53-56. Round answers to the nearest cent. Suppose that you have $12,000 to invest. Which investment yields the greater return over 3 years: 0.96% compounded monthly or 0.95% compounded continuously?
문제 57
Graph f and g in the same rectangular coordinate system. Then find the point of intersection of the two graphs. f(x) = 2x, g(x) = 2-x
문제 59
Graph y= 2x and x = 2y in the same rectangular coordinate system.
문제 61
Give the equation of each exponential function whose graph is shown.