Ch. 1 - Equations and Inequalities
Blitzer - College Algebra 8th Edition
Blitzer8th EditionCollege AlgebraISBN: 9780136970514당신이 사용하는 게 아니라요?교과서 변경
2장, 문제 28

Graph each equation in Exercises 13 - 28. Let x = - 3, - 2, - 1, 0, 1, 2, 3
y = x3 - 1

검증된 단계별 안내
1
Step 1: Understand the equation y = x^3 - 1. This is a cubic function, where the variable x is raised to the power of 3, and then 1 is subtracted. Cubic functions typically have an S-shaped curve when graphed.
Step 2: Create a table of values for the given x-values (-3, -2, -1, 0, 1, 2, 3). For each x-value, substitute it into the equation y = x^3 - 1 to calculate the corresponding y-value. For example, when x = -3, calculate y = (-3)^3 - 1.
Step 3: Plot the points (x, y) on a coordinate plane using the x-values and their corresponding y-values from the table. For example, if x = -3 gives y = -28, plot the point (-3, -28). Repeat this for all x-values.
Step 4: After plotting all the points, observe the general shape of the graph. Since this is a cubic function, the graph will have an S-shaped curve, increasing steeply for large positive x-values and decreasing steeply for large negative x-values.
Step 5: Draw a smooth curve through the plotted points to complete the graph. Ensure the curve reflects the behavior of a cubic function, smoothly transitioning through the points and extending in both directions.

비슷한 문제에 대한 검증된 영상 답변:

이 영상 해법은 위 문제에 도움이 된다고 튜터들이 추천한 것입니다.
영상 길이:
2m
도움이 되었나요?

주요 개념

질문에 올바르게 답하기 위해 반드시 이해해야 하는 핵심 개념들은 다음과 같습니다.

Graphing Functions

Graphing functions involves plotting points on a coordinate plane to visualize the relationship between the independent variable (x) and the dependent variable (y). For the equation y = x^3 - 1, you will calculate y for each given x value, creating a set of points that can be connected to form the graph. Understanding how to interpret these graphs is crucial for analyzing the behavior of the function.
추천 영상:
5:26
Graphs of Logarithmic Functions

Cubic Functions

Cubic functions are polynomial functions of degree three, characterized by the general form y = ax^3 + bx^2 + cx + d. The graph of a cubic function can exhibit various shapes, including one or two turning points, and can extend infinitely in both directions. Recognizing the properties of cubic functions, such as their end behavior and symmetry, is essential for accurate graphing.
추천 영상:
4:56
Function Composition

Evaluating Expressions

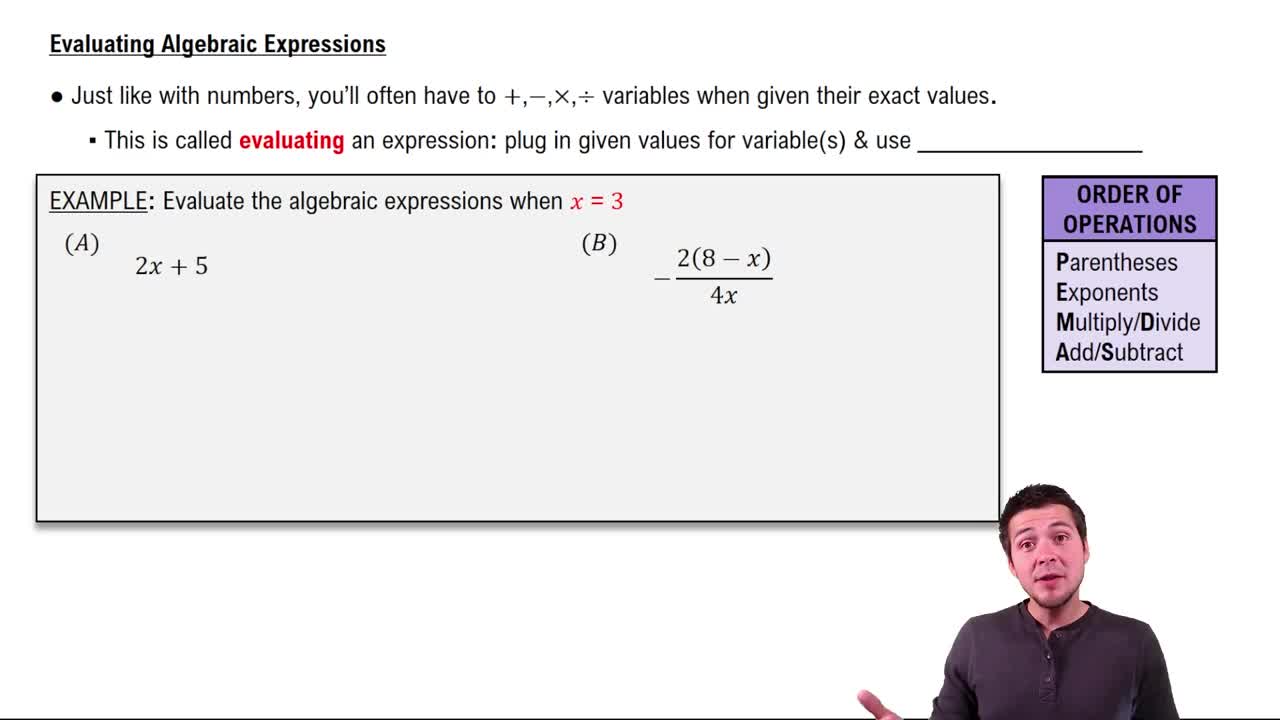
Evaluating expressions involves substituting specific values for variables in an equation to find the corresponding output. In this case, substituting the values of x (-3, -2, -1, 0, 1, 2, 3) into the equation y = x^3 - 1 allows you to compute the corresponding y values. Mastery of this skill is fundamental for graphing and understanding the function's behavior.
추천 영상:
03:11
Evaluating Algebraic Expressions