Ch. 1 - Equations and Inequalities
Blitzer - College Algebra 8th Edition
Blitzer8th EditionCollege AlgebraISBN: 9780136970514당신이 사용하는 게 아니라요?교과서 변경
2장, 문제 27

In all exercises, other than exercises with no solution, use interval notation to express solution sets and graph each solution set on a number line. In Exercises 27–50, solve each linear inequality. 5x + 11 < 26

검증된 단계별 안내
1
Start with the given inequality: \(5x + 11 < 26\).
Isolate the term with the variable by subtracting 11 from both sides: \(5x + 11 - 11 < 26 - 11\), which simplifies to \(5x < 15\).
Next, solve for \(x\) by dividing both sides of the inequality by 5: \(\frac{5x}{5} < \frac{15}{5}\), which simplifies to \(x < 3\).
Express the solution set in interval notation. Since \(x\) is less than 3, the solution is all real numbers less than 3, written as \((-\infty, 3)\).
To graph the solution on a number line, draw a number line, place an open circle at 3 (because 3 is not included), and shade all points to the left of 3.

비슷한 문제에 대한 검증된 영상 답변:

이 영상 해법은 위 문제에 도움이 된다고 튜터들이 추천한 것입니다.
영상 길이:
2m
도움이 되었나요?

주요 개념

질문에 올바르게 답하기 위해 반드시 이해해야 하는 핵심 개념들은 다음과 같습니다.

Solving Linear Inequalities

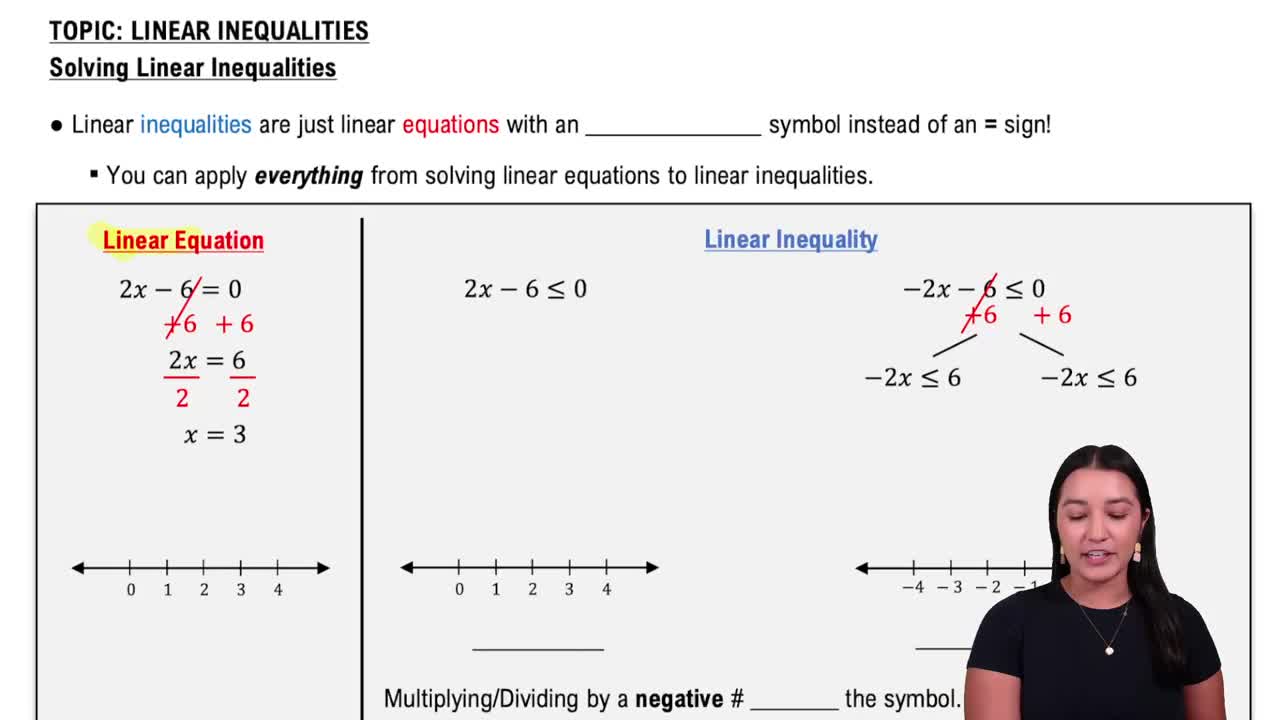
A linear inequality involves an inequality symbol (<, >, ≤, ≥) with a linear expression. To solve it, isolate the variable by performing inverse operations, similar to solving linear equations, but remember to reverse the inequality sign when multiplying or dividing by a negative number.
추천 영상:
06:07
Linear Inequalities

Interval Notation

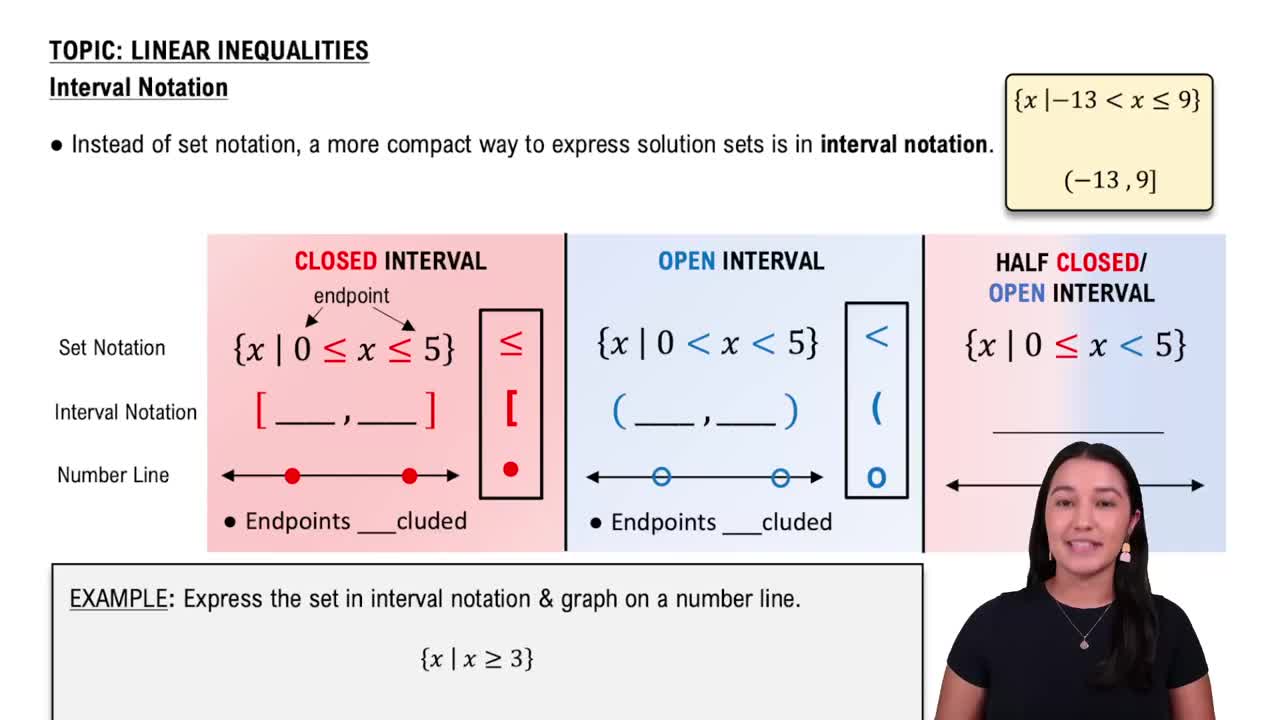
Interval notation is a way to represent solution sets of inequalities using parentheses and brackets. Parentheses indicate that an endpoint is not included, while brackets mean it is included. For example, (a, b) means all numbers between a and b, excluding a and b.
추천 영상:
05:18
Interval Notation

Graphing Solution Sets on a Number Line

Graphing solution sets involves shading the region on a number line that satisfies the inequality. Open circles represent excluded endpoints, and closed circles represent included endpoints. This visual helps understand the range of possible values for the variable.
추천 영상:
가이드 코스
02:35
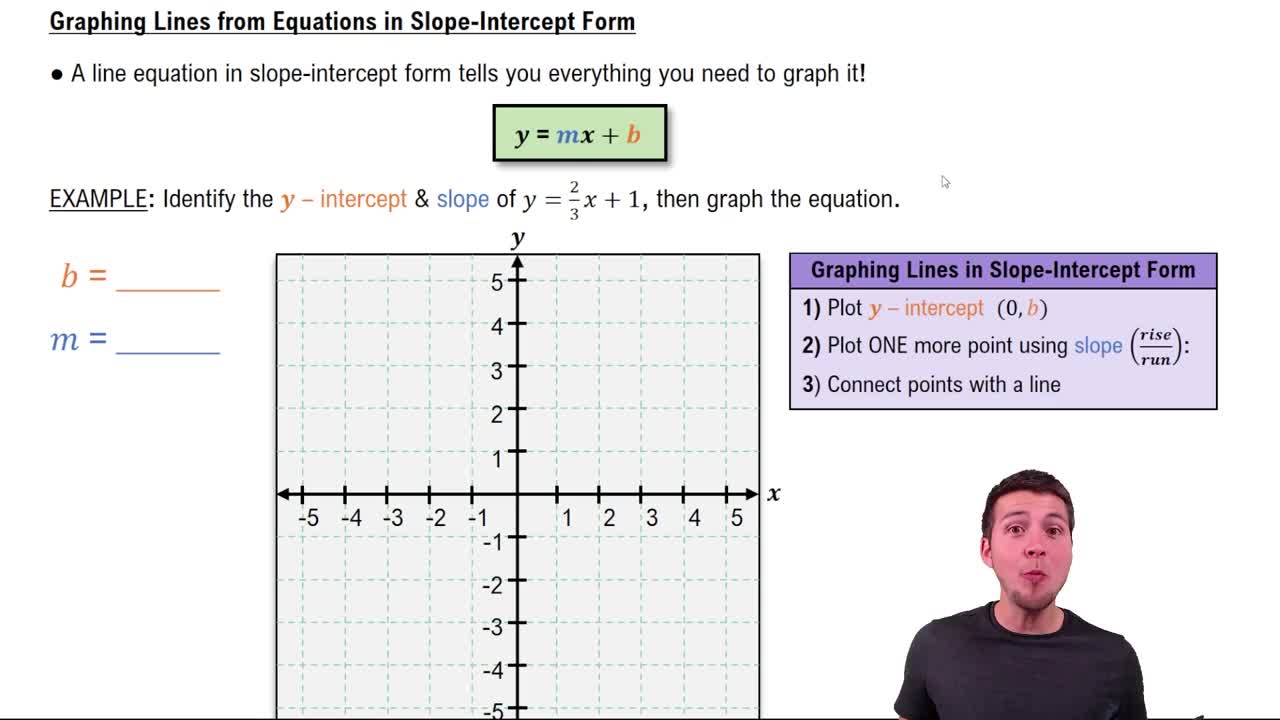
Graphing Lines in Slope-Intercept Form