
교과서 질문
In Exercises 35–46, determine the constant that should be added to the binomial so that it becomes a perfect square trinomial. Then write and factor the trinomial.
956
views

 검증된 단계별 안내
 04:08
04:08 04:08
04:08 02:16
02:16In Exercises 35–46, determine the constant that should be added to the binomial so that it becomes a perfect square trinomial. Then write and factor the trinomial.
In Exercises 35–46, determine the constant that should be added to the binomial so that it becomes a perfect square trinomial. Then write and factor the trinomial.
In Exercises 36–43, use the five-step strategy for solving word problems. The length of a rectangular field is 6 yards less than triple the width. If the perimeter of the field is 340 yards, what are its dimensions?
Exercises 41–60 contain rational equations with variables in denominators. For each equation, a. write the value or values of the variable that make a denominator zero. These are the restrictions on the variable. b. Keeping the restrictions in mind, solve the equation. 4/x = 5/2x + 3
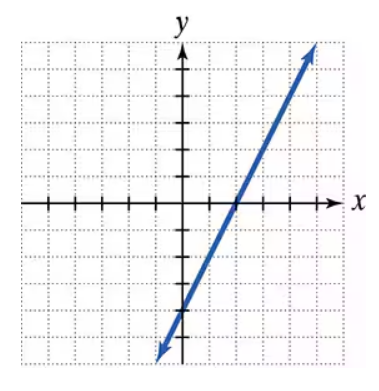
Use the graph to a. determine the x-intercepts, if any; b. determine the y-intercepts, if any. For each graph, tick marks along the axes represent one unit each.
In Exercises 35–54, solve each formula for the specified variable. Do you recognize the formula? If so, what does it describe? E = mc2 for m