In all exercises, other than exercises with no solution, use interval notation to express solution sets and graph each solution set on a number line. In Exercises 27–50, solve each linear inequality. 1 - x/2 > 4
Ch. 1 - Equations and Inequalities

2장, 문제 43a
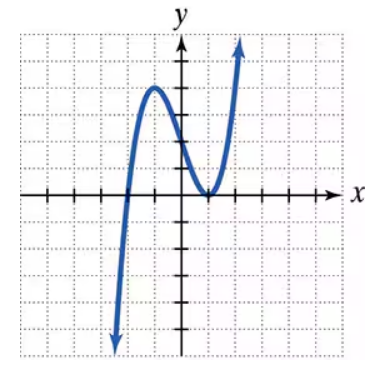
Use the graph to a. determine the x-intercepts, if any; b. determine the y-intercepts, if any. For each graph, tick marks along the axes represent one unit each.

검증된 단계별 안내1
Observe the graph and identify the points where the curve crosses the x-axis. These points are the x-intercepts. The x-intercepts occur when the y-value is 0.
From the graph, locate the x-coordinates of the points where the curve intersects the x-axis. These are the x-intercepts.
Next, identify the point where the curve crosses the y-axis. This point is the y-intercept. The y-intercept occurs when the x-value is 0.
From the graph, locate the y-coordinate of the point where the curve intersects the y-axis. This is the y-intercept.
Summarize the x-intercepts and y-intercept based on the observations from the graph.

비슷한 문제에 대한 검증된 영상 답변:
이 영상 해법은 위 문제에 도움이 된다고 튜터들이 추천한 것입니다.
영상 길이:
1m도움이 되었나요?
주요 개념
질문에 올바르게 답하기 위해 반드시 이해해야 하는 핵심 개념들은 다음과 같습니다.
X-Intercepts
X-intercepts are the points where a graph crosses the x-axis. At these points, the value of y is zero. To find the x-intercepts, one can set the function equal to zero and solve for x. In graphical terms, these are the horizontal intersections of the curve with the x-axis.
추천 영상:
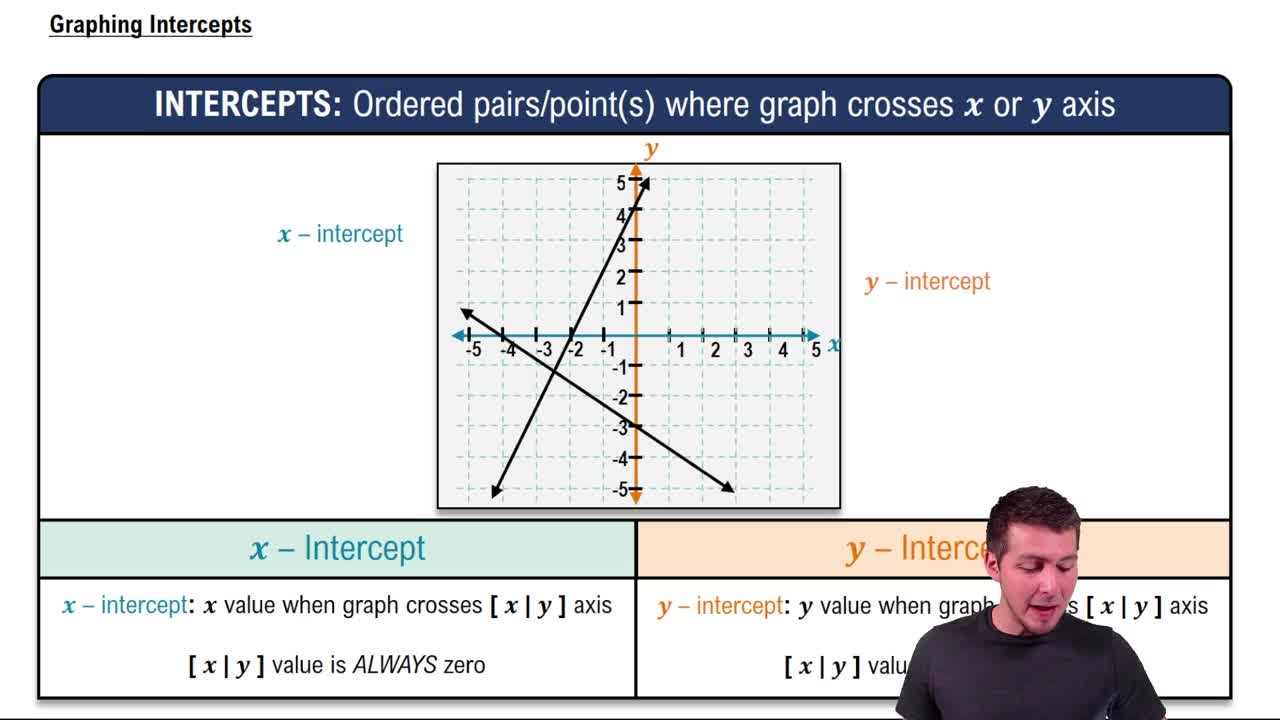
Graphing Intercepts
Y-Intercepts
Y-intercepts are the points where a graph crosses the y-axis, occurring when the value of x is zero. To determine the y-intercept, substitute x = 0 into the function and solve for y. Graphically, these points represent the vertical intersections of the curve with the y-axis.
추천 영상:
Graphing Intercepts
Graph Interpretation
Graph interpretation involves analyzing the visual representation of a function to extract meaningful information, such as intercepts, trends, and behavior at extremes. Understanding how to read a graph, including the significance of axes and tick marks, is crucial for accurately identifying intercepts and other features of the function.
추천 영상:
Graphs and Coordinates - Example
관련 실천
교과서 질문
770
views
교과서 질문
Solve and check: 24 + 3 (x + 2) = 5(x − 12).
873
views
교과서 질문
In Exercises 37–52, perform the indicated operations and write the result in standard form. (- 3 - √-7)2
830
views
교과서 질문
Use the graph to a. determine the x-intercepts, if any; b. determine the y-intercepts, if any. For each graph, tick marks along the axes represent one unit each.
112
views
교과서 질문
Exercises 41–60 contain rational equations with variables in denominators. For each equation, a. write the value or values of the variable that make a denominator zero. These are the restrictions on the variable. b. Keeping the restrictions in mind, solve the equation. 7/2x - 5/3x = 22/3
844
views
교과서 질문
Solve each equation in Exercises 41–60 by making an appropriate substitution.
720
views