Ch. 1 - Equations and Inequalities
Blitzer - College Algebra 8th Edition
Blitzer8th EditionCollege AlgebraISBN: 9780136970514당신이 사용하는 게 아니라요?교과서 변경
2장, 문제 47a

Write each English sentence as an equation in two variables. Then graph the equation. The y-value is four more than twice the x-value.

검증된 단계별 안내
1
Step 1: Start by translating the English sentence into a mathematical equation. The sentence states that 'The y-value is four more than twice the x-value.' This can be written as: y = 2x + 4.
Step 2: Identify the two variables in the equation. Here, x is the independent variable (input), and y is the dependent variable (output).
Step 3: To graph the equation, create a table of values. Choose a few values for x (e.g., -2, -1, 0, 1, 2) and calculate the corresponding y values using the equation y = 2x + 4.
Step 4: Plot the points from the table of values on a coordinate plane. For example, if x = 0, then y = 4, so plot the point (0, 4). Repeat this for all chosen x values.
Step 5: Draw a straight line through the plotted points, as the equation y = 2x + 4 represents a linear relationship. Label the graph with the equation for clarity.

비슷한 문제에 대한 검증된 영상 답변:

이 영상 해법은 위 문제에 도움이 된다고 튜터들이 추천한 것입니다.
영상 길이:
3m
도움이 되었나요?

주요 개념

질문에 올바르게 답하기 위해 반드시 이해해야 하는 핵심 개념들은 다음과 같습니다.

Linear Equations

Linear equations are mathematical statements that express a relationship between two variables, typically in the form y = mx + b, where m is the slope and b is the y-intercept. Understanding linear equations is essential for translating verbal statements into mathematical form, as they represent straight lines when graphed.
추천 영상:
06:00
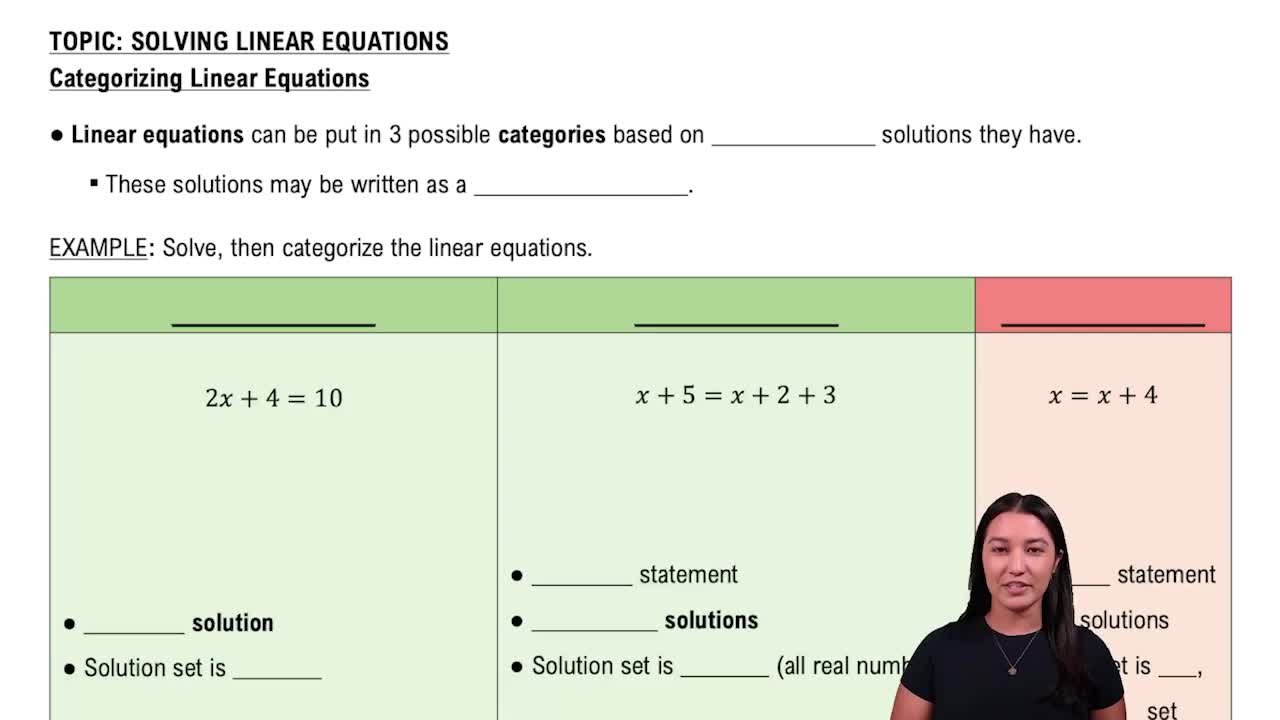
Categorizing Linear Equations

Translating English Sentences to Equations

Translating English sentences into equations involves identifying the mathematical relationships described in the text. This requires recognizing keywords and phrases that indicate operations, such as 'more than' or 'twice,' and converting them into algebraic expressions that accurately represent the relationships between the variables.
추천 영상:
06:00
Categorizing Linear Equations

Graphing Linear Equations

Graphing linear equations involves plotting points on a coordinate plane that satisfy the equation. By determining key values, such as the slope and y-intercept, one can draw a straight line that represents all solutions to the equation. This visual representation helps in understanding the relationship between the variables and analyzing their behavior.
추천 영상:
06:00
Categorizing Linear Equations