Use the vertical line test to identify graphs in which y is a function of x.
Ch. 2 - Functions and Graphs

3장, 문제 12
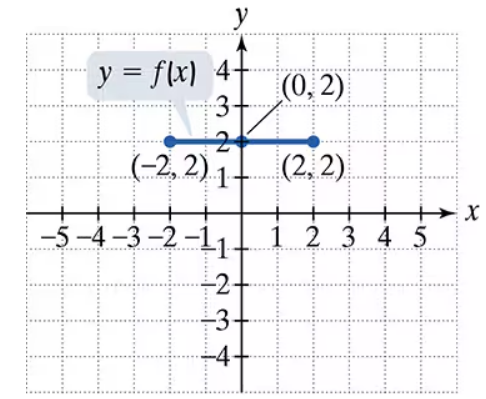
Use the graph of y = f(x) to graph each function g.

g(x) = 2f(x)
검증된 단계별 안내1
Step 1: Observe the graph of y = f(x). It is a horizontal line segment from (1, -3) to (4, -3), meaning the function f(x) is constant and equal to -3 for all x in the interval [1, 4].
Step 2: Understand the transformation g(x) = 2f(x). This means that the values of f(x) are multiplied by 2 to produce g(x). Mathematically, g(x) = 2 * (-3) = -6 for all x in the interval [1, 4].
Step 3: Determine the new graph of g(x). Since g(x) is constant and equal to -6, the graph of g(x) will also be a horizontal line segment, but at y = -6 instead of y = -3.
Step 4: Plot the new line segment for g(x). The endpoints of the line segment will remain the same in terms of x-coordinates, so the new line segment will extend from (1, -6) to (4, -6).
Step 5: Label the graph appropriately. Indicate that the new graph represents g(x) = 2f(x), and ensure the horizontal line segment is clearly drawn at y = -6 between x = 1 and x = 4.

비슷한 문제에 대한 검증된 영상 답변:
이 영상 해법은 위 문제에 도움이 된다고 튜터들이 추천한 것입니다.
영상 길이:
1m도움이 되었나요?
주요 개념
질문에 올바르게 답하기 위해 반드시 이해해야 하는 핵심 개념들은 다음과 같습니다.
Function Transformation
Function transformation refers to the process of altering the graph of a function through various operations, such as vertical or horizontal shifts, stretches, or reflections. In this case, the function g(x) = 2f(x) represents a vertical stretch of the original function f(x) by a factor of 2, which means that every output value of f(x) is multiplied by 2.
추천 영상:
Domain & Range of Transformed Functions
Graphing Functions
Graphing functions involves plotting points on a coordinate plane based on the function's input-output relationship. For the function g(x) = 2f(x), the graph can be derived from the graph of f(x) by taking each y-coordinate of f(x) and multiplying it by 2, effectively doubling the height of the graph while keeping the x-coordinates the same.
추천 영상:
Graphs of Logarithmic Functions
Horizontal and Vertical Lines
Horizontal lines in a graph represent constant functions where the output value remains the same regardless of the input. In the provided graph, f(x) is a horizontal line at y = -3 between x = 1 and x = 4. When transforming this line to g(x) = 2f(x), the new line will be at y = -6, maintaining its horizontal nature but at a different vertical position.
추천 영상:
가이드 코스
The Slope of a Line
관련 실천
교과서 질문
190
views
교과서 질문
Use the graph of y = f(x) to graph each function g.
g(x) = ½ f(x)
1721
views
교과서 질문
Find the domain of each function. f(x) = 1/(x2+1) - 1/(x2-1)
969
views
교과서 질문
Use the given conditions to write an equation for each line in point-slope form and general form. Passing through (5, −9) and perpendicular to the line whose equation is x + 7y - 12= 0
170
views
교과서 질문
Find the distance between each pair of points. If necessary, express answers in simplified radical form and then round to two decimal places. (3.5, 8.2) and (-0.5, 6.2)
831
views
교과서 질문
The functions in Exercises 11-28 are all one-to-one. For each function, a. Find an equation for f-1(x), the inverse function. b. Verify that your equation is correct by showing that f(ƒ-1 (x)) = = x and ƒ-1 (f(x)) = x. f(x) = 2x
614
views