Ch. 2 - Functions and Graphs
Blitzer - College Algebra 8th Edition
Blitzer8th EditionCollege AlgebraISBN: 9780136970514당신이 사용하는 게 아니라요?교과서 변경
3장, 문제 28

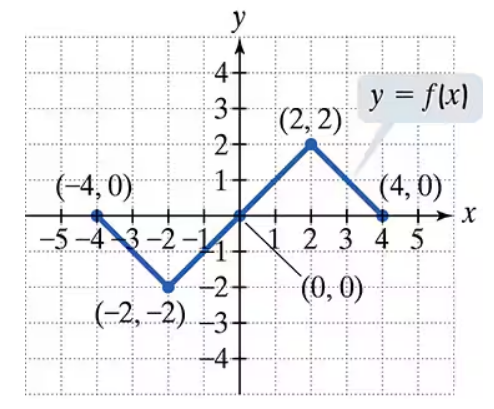
Use the graph of y = f(x) to graph each function g.

g(x) = ½ f(x)

검증된 단계별 안내
1
Step 1: Understand the transformation. The function g(x) = ½ f(x) represents a vertical compression of the graph of f(x) by a factor of ½. This means that all y-values of the original graph will be halved, while the x-values remain unchanged.
Step 2: Identify key points on the graph of f(x). From the graph, two key points are highlighted: (3, 0) and (0, -27). These points will be transformed according to the rule g(x) = ½ f(x).
Step 3: Apply the transformation to the y-values of the key points. For the point (3, 0), the y-value is 0, and halving it results in 0. For the point (0, -27), the y-value is -27, and halving it results in -13.5.
Step 4: Plot the transformed points on the graph of g(x). The new points after transformation are (3, 0) and (0, -13.5). These points represent the compressed version of the original graph.
Step 5: Sketch the graph of g(x). Use the transformed points and the general shape of the original graph to draw the new graph. Ensure that all y-values are halved while maintaining the same x-values.

비슷한 문제에 대한 검증된 영상 답변:

이 영상 해법은 위 문제에 도움이 된다고 튜터들이 추천한 것입니다.
영상 길이:
2m
도움이 되었나요?

주요 개념

질문에 올바르게 답하기 위해 반드시 이해해야 하는 핵심 개념들은 다음과 같습니다.

Function Transformation

Function transformation refers to the process of altering the graph of a function through various operations, such as stretching, compressing, translating, or reflecting. In this case, the function g(x) = ½ f(x) represents a vertical compression of the original function f(x) by a factor of 1/2, which means that all y-values of f(x) are halved.
추천 영상:
4:22
Domain & Range of Transformed Functions

Graphing Functions

Graphing functions involves plotting points on a coordinate plane to visually represent the relationship between the input (x) and output (y) values of a function. Understanding how to read and interpret the graph of f(x) is crucial for accurately graphing g(x), as it allows one to apply the transformation rules effectively.
추천 영상:
5:26
Graphs of Logarithmic Functions

Coordinates of Points

Coordinates of points on a graph indicate the specific location of points in the Cartesian plane, represented as (x, y). In the given graph, the points (3, 0) and (0, -27) are significant as they provide reference points for the function f(x). When transforming to g(x), these coordinates will also change according to the transformation applied.
추천 영상:
02:16
Graphs and Coordinates - Example