
교과서 질문
The functions in Exercises 11-28 are all one-to-one. For each function, a. Find an equation for f-1(x), the inverse function. b. Verify that your equation is correct by showing that f(ƒ-1 (x)) = = x and ƒ-1 (f(x)) = x. f(x) = x³ +2
637
views

 검증된 단계별 안내

 4:22
4:22
 5:26
5:26 05:01
05:01The functions in Exercises 11-28 are all one-to-one. For each function, a. Find an equation for f-1(x), the inverse function. b. Verify that your equation is correct by showing that f(ƒ-1 (x)) = = x and ƒ-1 (f(x)) = x. f(x) = x³ +2
In Exercises 11–26, determine whether each equation defines y as a function of x. x = y²
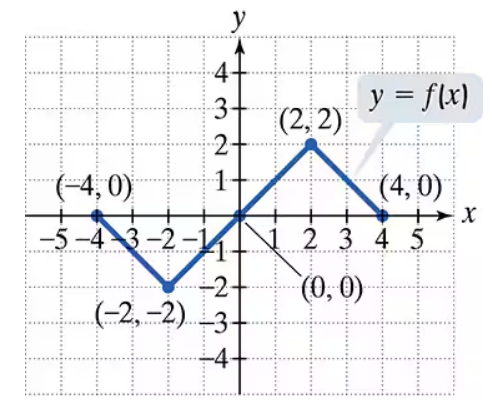
Use the graph to determine (a) the function's domain, (b) the function's range, (c) the x-intercepts, if any, (d) the y-intercept, if there is one, (e) intervals on which the function is increasing, decreasing or constant, (f) the missing function values, indicated by question marks, below each graph.
Find the domain of each function. f(x) = √(x - 3)
Find the average rate of change of the function from x1 to x2. f(x) = √x from x1 = 4 to x2 = 9
Find the distance between each pair of points. If necessary, express answers in simplified radical form and then round to two decimal places. (7/3, 1/5) and (1/3, 6/5)