Ch. 2 - Functions and Graphs
Blitzer - College Algebra 8th Edition
Blitzer8th EditionCollege AlgebraISBN: 9780136970514당신이 사용하는 게 아니라요?교과서 변경
3장, 문제 20

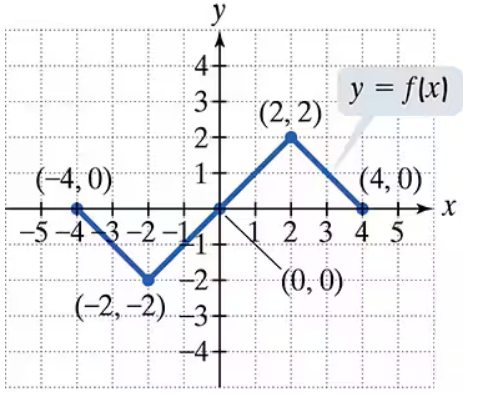
Use the graph of y = f(x) to graph each function g. g(x) = f(x+1)

검증된 단계별 안내
1
Step 1: Understand the transformation represented by g(x) = f(x+1). This equation indicates a horizontal shift of the graph of f(x). Specifically, adding 1 inside the parentheses shifts the graph to the left by 1 unit.
Step 2: Identify key points on the graph of y = f(x). These key points might include the x-intercepts, y-intercepts, and any other notable points such as vertices or turning points.
Step 3: Apply the horizontal shift to each key point. For each point (x, y) on the graph of f(x), subtract 1 from the x-coordinate to find the corresponding point on the graph of g(x). The new point will be (x-1, y).
Step 4: Redraw the graph using the shifted points. Plot the new points on the coordinate plane and ensure the shape of the graph remains consistent with the original graph of f(x).
Step 5: Verify the transformation. Check that the graph of g(x) = f(x+1) is indeed shifted 1 unit to the left compared to the graph of f(x). Ensure all points and features of the graph are correctly adjusted.

비슷한 문제에 대한 검증된 영상 답변:

이 영상 해법은 위 문제에 도움이 된다고 튜터들이 추천한 것입니다.
영상 길이:
2m
도움이 되었나요?

주요 개념

질문에 올바르게 답하기 위해 반드시 이해해야 하는 핵심 개념들은 다음과 같습니다.

Function Transformation

Function transformation refers to the changes made to the graph of a function based on modifications to its equation. In this case, g(x) = f(x + 1) represents a horizontal shift of the function f(x) to the left by 1 unit. Understanding how transformations affect the graph is crucial for accurately sketching the new function.
추천 영상:
4:22
Domain & Range of Transformed Functions

Horizontal Shifts

Horizontal shifts occur when the input variable of a function is altered by adding or subtracting a constant. For g(x) = f(x + 1), the '+1' indicates that every point on the graph of f(x) moves left by 1 unit. This concept is essential for predicting how the graph of g will relate to the original function f.
추천 영상:
5:34
Shifts of Functions

Graph Interpretation

Graph interpretation involves analyzing the visual representation of a function to understand its behavior and characteristics. By examining the graph of y = f(x), one can identify key features such as intercepts, maxima, and minima, which will help in accurately plotting g(x) after applying the transformation.
추천 영상:
02:16
Graphs and Coordinates - Example