Ch. 2 - Functions and Graphs
Blitzer - College Algebra 8th Edition
Blitzer8th EditionCollege AlgebraISBN: 9780136970514당신이 사용하는 게 아니라요?교과서 변경
3장, 문제 43

Give the slope and y-intercept of each line whose equation is given. Then graph the linear function. f(x) = (3/4)x-2

검증된 단계별 안내
1
Identify the given linear function: \(f(x) = \frac{3}{4}x - 2\).
Recall that the slope-intercept form of a line is \(y = mx + b\), where \(m\) is the slope and \(b\) is the y-intercept.
Compare the given function to the slope-intercept form to find the slope \(m = \frac{3}{4}\) and the y-intercept \(b = -2\).
To graph the line, start by plotting the y-intercept point at \((0, -2)\) on the coordinate plane.
From the y-intercept, use the slope \(\frac{3}{4}\) to find another point: rise 3 units up and run 4 units to the right, then draw the line through these points.

비슷한 문제에 대한 검증된 영상 답변:

이 영상 해법은 위 문제에 도움이 된다고 튜터들이 추천한 것입니다.
영상 길이:
2m
도움이 되었나요?

주요 개념

질문에 올바르게 답하기 위해 반드시 이해해야 하는 핵심 개념들은 다음과 같습니다.

Slope of a Linear Function

The slope represents the rate of change of the function and indicates how steep the line is. It is the coefficient of x in the equation f(x) = mx + b, where m is the slope. A positive slope means the line rises, while a negative slope means it falls.
추천 영상:
06:07
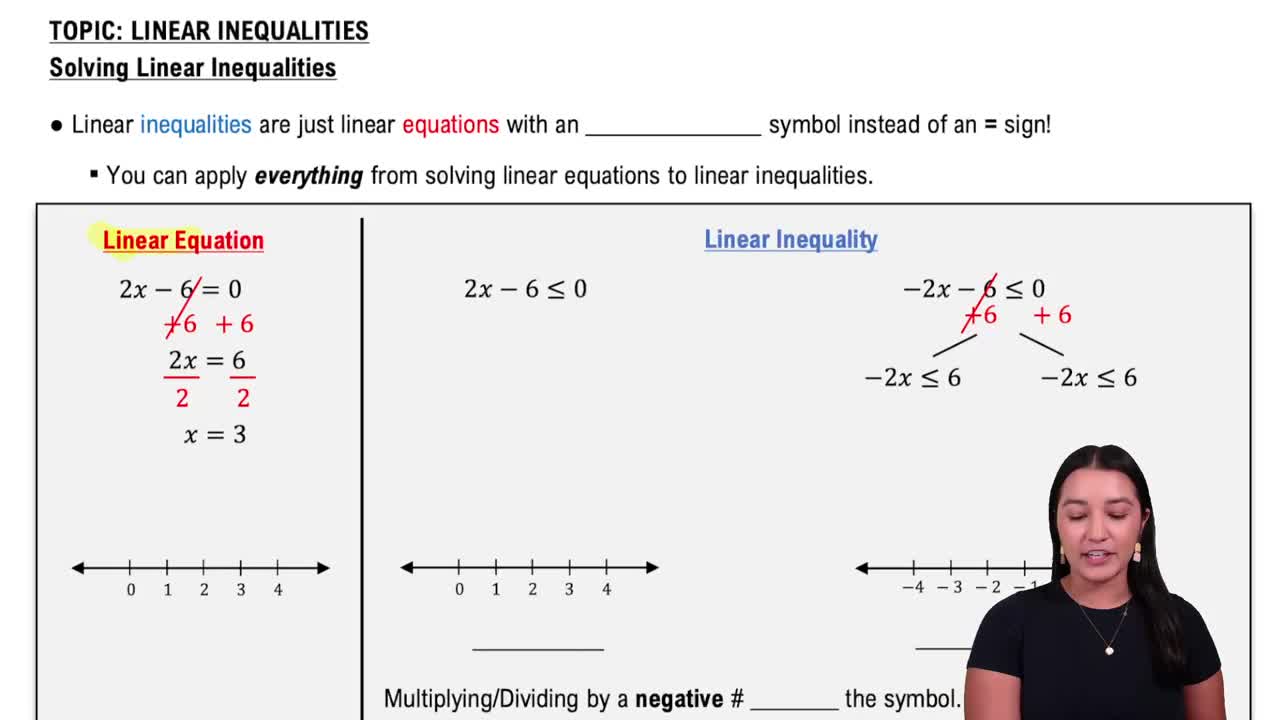
Linear Inequalities

Y-Intercept of a Linear Function

The y-intercept is the point where the line crosses the y-axis, given by the constant term b in the equation f(x) = mx + b. It represents the value of the function when x is zero and is essential for graphing the line accurately.
추천 영상:
06:07
Linear Inequalities

Graphing Linear Functions

Graphing involves plotting the y-intercept on the coordinate plane and using the slope to find other points by rising and running from the intercept. Connecting these points forms the line representing the function, visually showing its behavior.
추천 영상:
5:26
Graphs of Logarithmic Functions