Ch. 2 - Functions and Graphs
Blitzer - College Algebra 8th Edition
Blitzer8th EditionCollege AlgebraISBN: 9780136970514당신이 사용하는 게 아니라요?교과서 변경
3장, 문제 46

In Exercises 39–50, graph the given functions, f and g, in the same rectangular coordinate system. Select integers for x, starting with -2 and ending with 2. Once you have obtained your graphs, describe how the graph of g is related to the graph of f. f(x)= |x|, g(x) = |x| +1

검증된 단계별 안내
1
Identify the given functions: \( f(x) = |x| \) and \( g(x) = |x| + 1 \).
Create a table of values for \( x \) from -2 to 2 for both functions. For each \( x \), calculate \( f(x) = |x| \) and \( g(x) = |x| + 1 \).
Plot the points for \( f(x) \) on the coordinate plane using the values from the table. Connect these points to form the graph of \( f(x) = |x| \), which is a V-shaped graph with its vertex at the origin (0,0).
Plot the points for \( g(x) \) on the same coordinate plane using the values from the table. Connect these points to form the graph of \( g(x) = |x| + 1 \), which will also be a V-shaped graph but shifted vertically.
Compare the two graphs and describe the transformation: since \( g(x) = f(x) + 1 \), the graph of \( g \) is the graph of \( f \) shifted upward by 1 unit.

비슷한 문제에 대한 검증된 영상 답변:

이 영상 해법은 위 문제에 도움이 된다고 튜터들이 추천한 것입니다.
영상 길이:
5m
도움이 되었나요?

주요 개념

질문에 올바르게 답하기 위해 반드시 이해해야 하는 핵심 개념들은 다음과 같습니다.

Absolute Value Function

The absolute value function, denoted |x|, outputs the non-negative value of x. Its graph is a V-shaped curve with the vertex at the origin (0,0), reflecting all negative inputs as positive outputs. Understanding this shape is essential for graphing f(x) = |x|.
추천 영상:
4:56
Function Composition

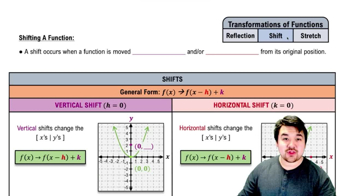
Function Transformation - Vertical Shift

Adding a constant to a function, as in g(x) = |x| + 1, shifts the graph vertically. Specifically, adding +1 moves the entire graph of f(x) = |x| up by one unit without changing its shape. Recognizing vertical shifts helps compare g(x) to f(x).
추천 영상:
5:34
Shifts of Functions

Graphing with Integer Inputs

Selecting integer values for x, such as from -2 to 2, allows for plotting specific points to visualize the function's graph. This method helps in accurately sketching and comparing the graphs of f and g on the same coordinate system.
추천 영상:
가이드 코스
02:16
Graphs and Coordinates - Example