Ch. 2 - Functions and Graphs
Blitzer - College Algebra 8th Edition
Blitzer8th EditionCollege AlgebraISBN: 9780136970514당신이 사용하는 게 아니라요?교과서 변경
3장, 문제 55a

Graph each equation in a rectangular coordinate system. f(x) = 1

검증된 단계별 안내
1
Identify the type of function: The given equation is f(x) = 1. This is a constant function, meaning the output value (y) is always 1, regardless of the input value (x).
Understand the graph of a constant function: A constant function is represented by a horizontal line on the graph because the y-value does not change as x changes.
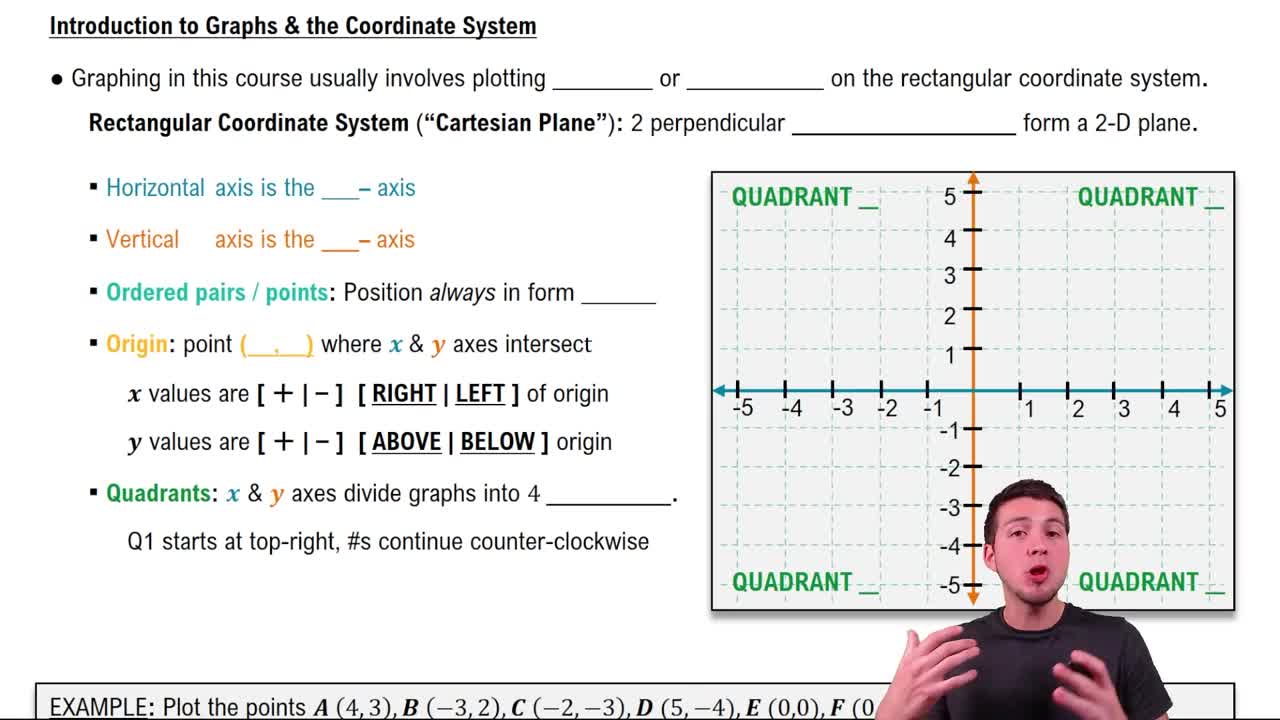
Set up the rectangular coordinate system: Draw the x-axis (horizontal) and y-axis (vertical) on a graph. Label the axes and include a scale for both x and y values.
Plot points for the function: Since f(x) = 1, the y-value is always 1. Choose several x-values (e.g., -2, 0, 2) and plot the corresponding points (-2, 1), (0, 1), and (2, 1).
Draw the graph: Connect the plotted points with a straight horizontal line that extends infinitely in both directions. Label the line as f(x) = 1 to complete the graph.

비슷한 문제에 대한 검증된 영상 답변:

이 영상 해법은 위 문제에 도움이 된다고 튜터들이 추천한 것입니다.
영상 길이:
1m
도움이 되었나요?

주요 개념

질문에 올바르게 답하기 위해 반드시 이해해야 하는 핵심 개념들은 다음과 같습니다.

Rectangular Coordinate System

A rectangular coordinate system, also known as the Cartesian coordinate system, consists of two perpendicular axes: the x-axis (horizontal) and the y-axis (vertical). Each point in this system is defined by an ordered pair (x, y), where 'x' represents the horizontal position and 'y' represents the vertical position. Understanding this system is crucial for graphing equations accurately.
추천 영상:
가이드 코스
05:10
Graphs & the Rectangular Coordinate System

Graphing Functions

Graphing functions involves plotting points that satisfy the function's equation on the coordinate system. For the function f(x) = 1, this means that for every value of 'x', the output 'f(x)' is always 1. This results in a horizontal line across the y-axis at y = 1, illustrating the concept of constant functions.
추천 영상:
5:26
Graphs of Logarithmic Functions

Horizontal Lines

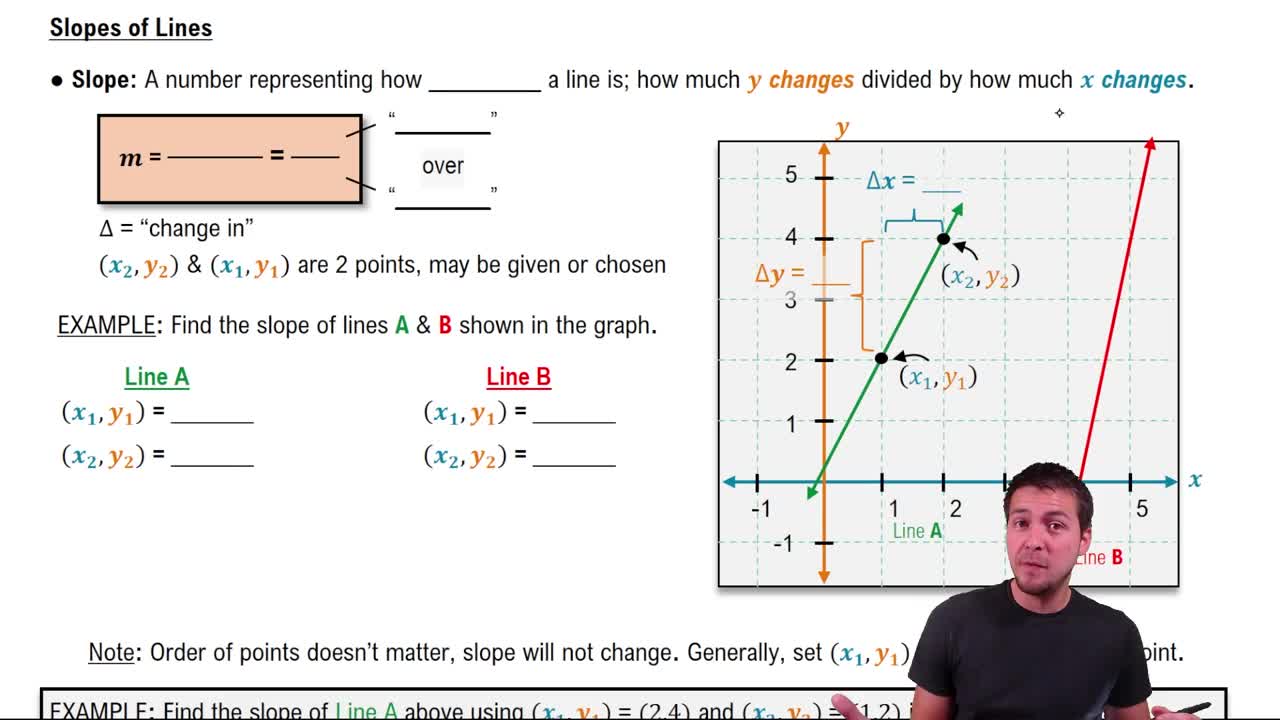
A horizontal line in a coordinate system is characterized by having a constant y-value regardless of the x-value. In the case of the function f(x) = 1, the line will run parallel to the x-axis at the height of y = 1. Recognizing the properties of horizontal lines is essential for understanding how to represent constant functions graphically.
추천 영상:
가이드 코스
06:49
The Slope of a Line