
교과서 질문
Use the graph of y = f(x) to graph each function g. g(x) = -f(x + 1) − 1
692
views

 검증된 단계별 안내
 02:35
02:35
 05:10
05:10 04:29
04:29Use the graph of y = f(x) to graph each function g. g(x) = -f(x + 1) − 1
In Exercises 39-52, a. Find an equation for ƒ¯¹(x). b. Graph ƒ and ƒ¯¹(x) in the same rectangular coordinate system. c. Use interval notation to give the domain and the range off and ƒ¯¹. f(x) = √(x-1)
In Exercises 41–52, give the center and radius of the circle described by the equation and graph each equation. Use the graph to identify the relation's domain and range. x² + (y − 1)² = 1
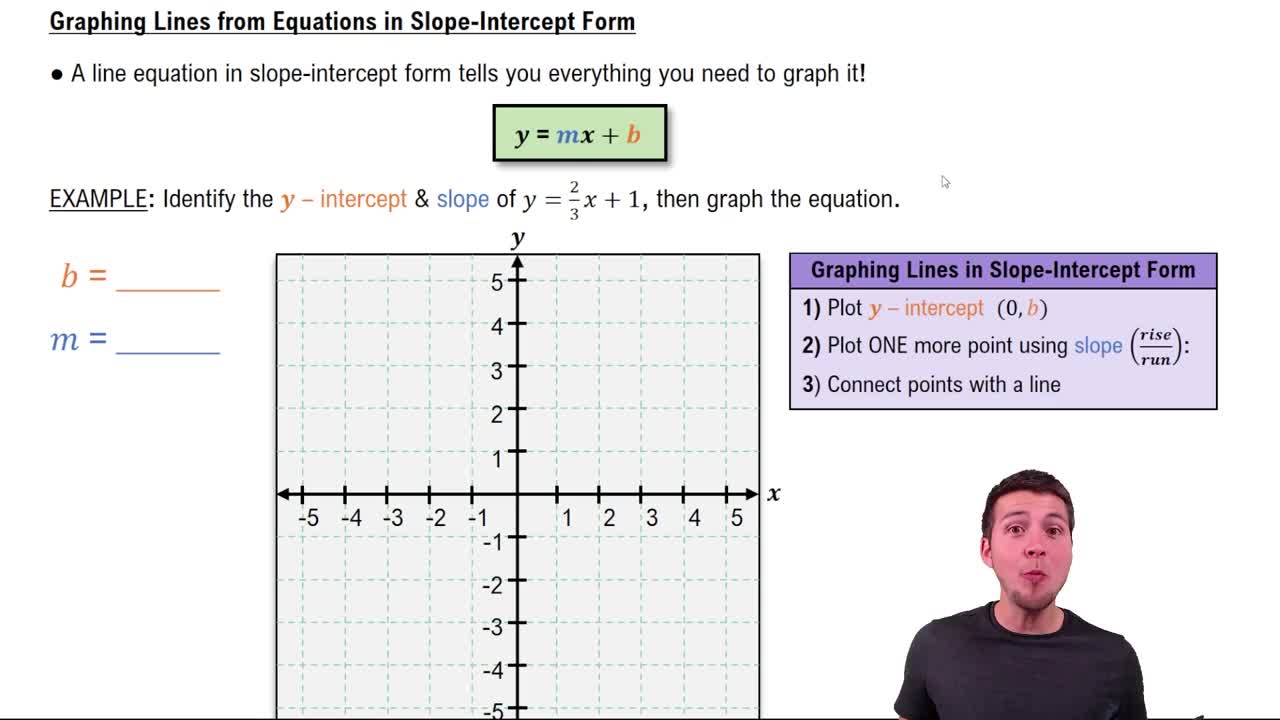
In Exercises 46–49, give the slope and y-intercept of each line whose equation is given. Then graph the line. 2x + 3y + 6 = 0
In Exercises 31–50, find ƒ+g, f−g, fg, and f/g. Determine the domain for each function. f(x) = √(x -2), g(x) = √(2-x)
Find ƒ+g, f−g, fg, and f/g. Determine the domain for each function. f(x) = √(x -2), g(x) = √(2-x)