Find a. (fog) (x) b. (go f) (x). f(x) = √x, g(x) = x − 1
Ch. 2 - Functions and Graphs

3장, 문제 62
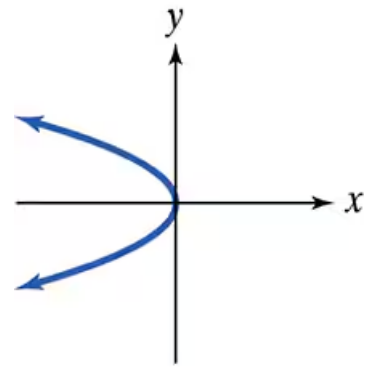
Use the vertical line test to identify graphs in which y is a function of x.

검증된 단계별 안내1
Recall that the vertical line test is used to determine if a graph represents a function of x. The test states that if any vertical line intersects the graph at more than one point, then y is not a function of x.
Observe the graph carefully and imagine drawing vertical lines (lines parallel to the y-axis) at various x-values along the curve.
Notice that for some x-values, a vertical line will intersect the graph at two points (one on the upper branch and one on the lower branch of the curve).
Since there are vertical lines that intersect the graph at more than one point, this means that for those x-values, there are multiple y-values.
Conclude that the graph does not pass the vertical line test, so y is not a function of x for this graph.

비슷한 문제에 대한 검증된 영상 답변:
이 영상 해법은 위 문제에 도움이 된다고 튜터들이 추천한 것입니다.
영상 길이:
50s도움이 되었나요?
주요 개념
질문에 올바르게 답하기 위해 반드시 이해해야 하는 핵심 개념들은 다음과 같습니다.
Vertical Line Test
The vertical line test is a visual method used to determine if a graph represents a function. If any vertical line drawn through the graph intersects it at more than one point, the graph does not represent a function because a single input (x-value) corresponds to multiple outputs (y-values).
추천 영상:
가이드 코스
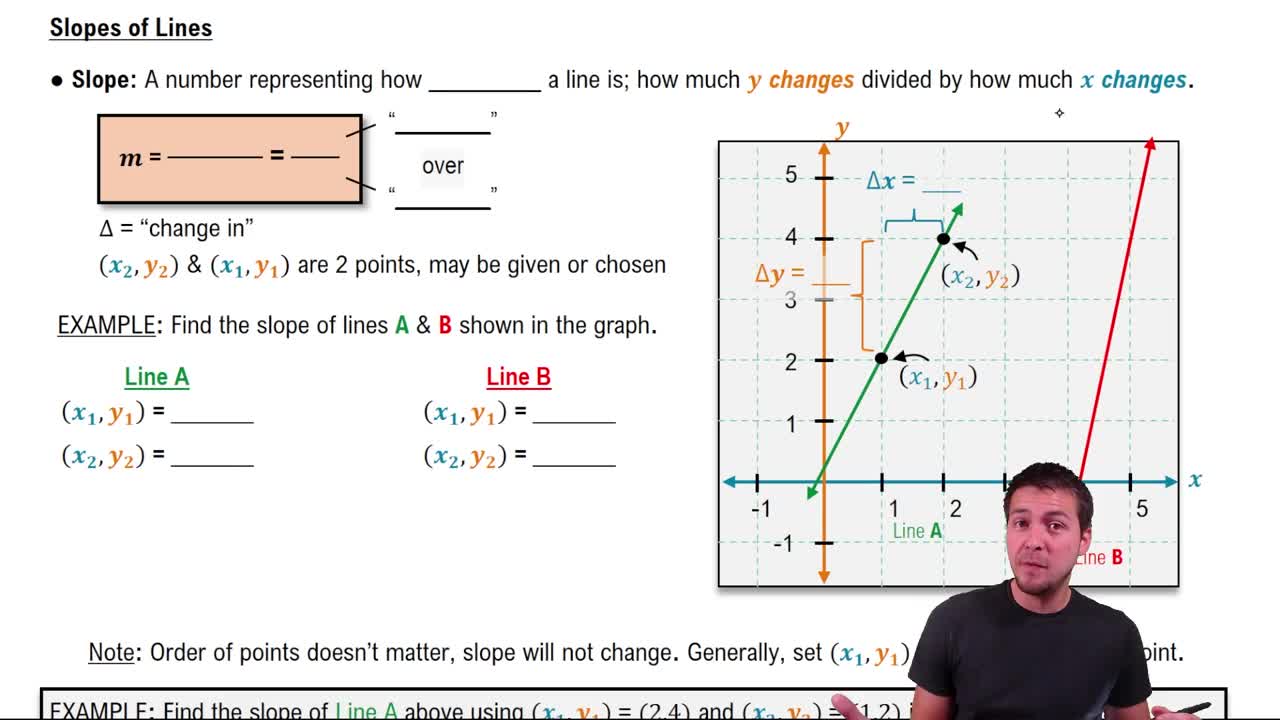
The Slope of a Line
Definition of a Function
A function is a relation where each input (x-value) has exactly one output (y-value). This means no x-value can be paired with more than one y-value. Understanding this definition is essential to apply the vertical line test correctly.
추천 영상:
Graphs of Common Functions
Graph Interpretation
Interpreting graphs involves understanding the relationship between variables and how they are represented visually. Recognizing the shape and behavior of the graph, such as whether it curves back or overlaps vertically, helps in applying tests like the vertical line test to identify functions.
추천 영상:
가이드 코스
Graphs and Coordinates - Example
관련 실천
교과서 질문
1093
views
교과서 질문
In Exercises 59-66, a. Rewrite the given equation in slope-intercept form. b. Give the slope and y-intercept. c. Use the slope and y-intercept to graph the linear function. 8x – 4y – 12 =0
162
views
교과서 질문
In Exercises 60–63, begin by graphing the standard quadratic function, f(x) = x2. Then use transformations of this graph to graph the given function. r(x) = -(x + 1)2
858
views
교과서 질문
Complete the square and write the equation in standard form. Then give the center and radius of each circle and graph the equation. x² + y² − x + 2y + 1 = 0
856
views
교과서 질문
Begin by graphing the standard quadratic function, f(x) = x². Then use transformations of this graph to graph the given function. g(x) = (1/2)(x − 1)²
868
views
교과서 질문
Find c. (fog) (2) d. (go f) (2). f(x) = √x, g(x) = x − 1
845
views