Ch. 2 - Functions and Graphs
Blitzer - College Algebra 8th Edition
Blitzer8th EditionCollege AlgebraISBN: 9780136970514당신이 사용하는 게 아니라요?교과서 변경
3장, 문제 78

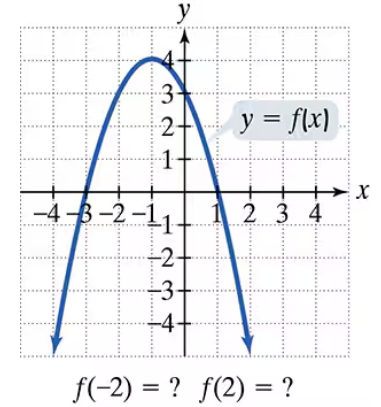
Use the graph to determine a.the x-intercepts, if any; b. the y-intercept, if any; and e. the missing function values, indicated by question marks, below each graph.

검증된 단계별 안내
1
Identify the x-intercepts by finding the points where the graph crosses the x-axis. These are points where the y-value is zero. From the graph, note the x-values at these points.
Identify the y-intercept by finding the point where the graph crosses the y-axis. This is the point where the x-value is zero. From the graph, note the y-value at this point.
To find the missing function values indicated by question marks, locate the corresponding x-values on the graph and determine the y-values by reading the height of the graph at those points.
Write down the coordinates of the x-intercepts and y-intercept clearly in the form \((x, 0)\) for x-intercepts and \((0, y)\) for the y-intercept.
Use the identified points to understand the behavior of the function and verify the missing values by checking if they align with the shape and trend of the graph.

비슷한 문제에 대한 검증된 영상 답변:

이 영상 해법은 위 문제에 도움이 된다고 튜터들이 추천한 것입니다.
영상 길이:
3m
도움이 되었나요?

주요 개념

질문에 올바르게 답하기 위해 반드시 이해해야 하는 핵심 개념들은 다음과 같습니다.

X-Intercepts

X-intercepts are points where the graph crosses the x-axis, meaning the y-value is zero at these points. Identifying x-intercepts involves finding the values of x for which the function equals zero. In the graph, these are marked as (0,0) and (5,0).
추천 영상:
가이드 코스
04:08
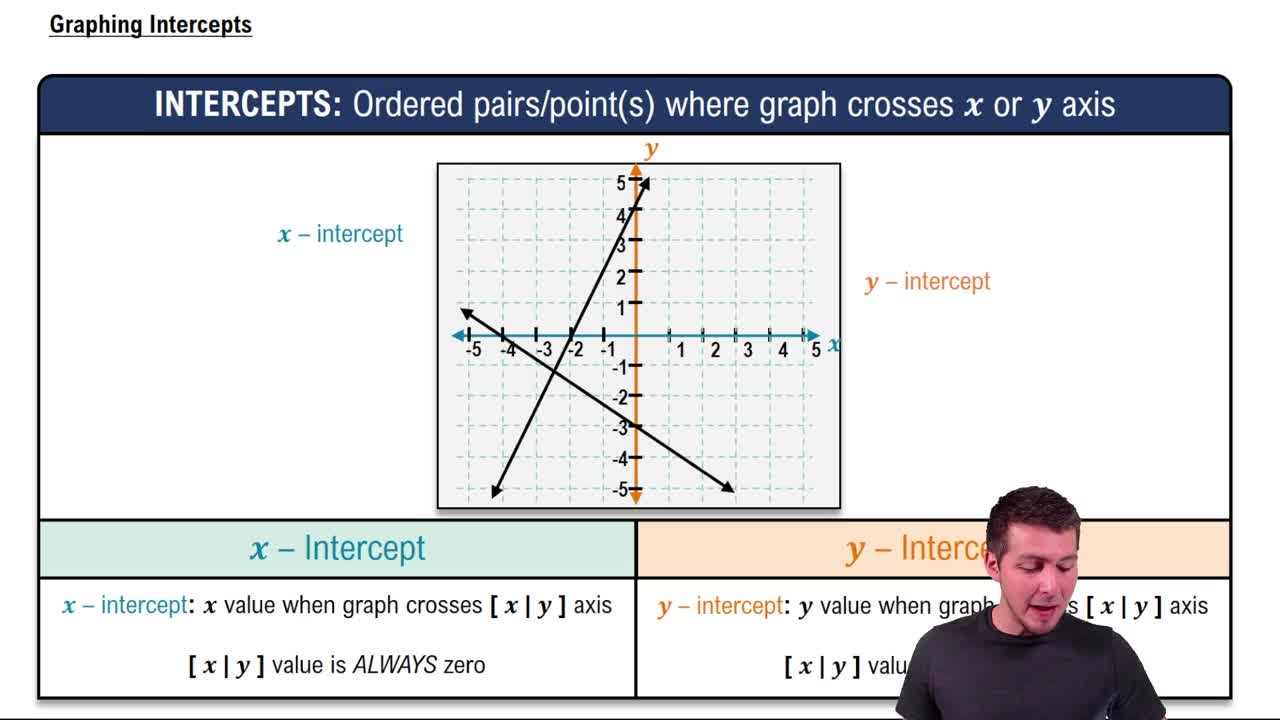
Graphing Intercepts

Y-Intercept

The y-intercept is the point where the graph crosses the y-axis, which occurs when x equals zero. This point shows the initial value of the function. In the graph, the y-intercept is at (0,7), indicating the function's value when x is zero.
추천 영상:
가이드 코스
04:08
Graphing Intercepts

Reading Function Values from a Graph

To determine missing function values, analyze the graph's points and their coordinates. Each point on the curve corresponds to an (x, y) pair, where y is the function value at x. Using the graph, you can estimate or identify exact values to fill in missing data.
추천 영상:
5:46
Graphs of Exponential Functions