
교과서 질문
Begin by graphing the absolute value function, f(x) = |x|. Then use transformations of this graph to graph the given function. g(x) = -|x + 4| +2
1076
views

 검증된 단계별 안내

 4:56
4:56
 4:26
4:26 02:16
02:16Begin by graphing the absolute value function, f(x) = |x|. Then use transformations of this graph to graph the given function. g(x) = -|x + 4| +2
In Exercises 77–92, use the graph to determine a. the function's domain; b. the function's range; c. the x-intercepts, if any; d. the y-intercept, if any; and e. the missing function values, indicated by question marks, below each graph.
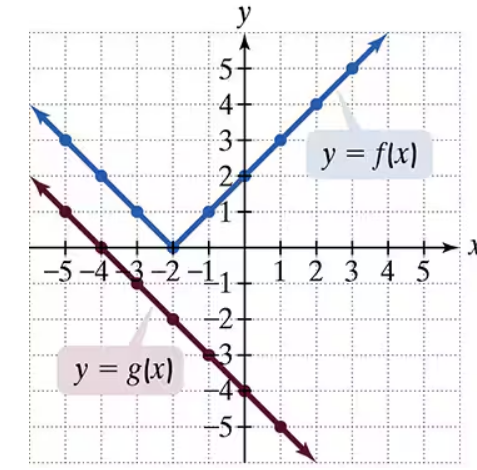
Use the graphs of f and g to solve Exercises 83–90.
Graph f-g.
In Exercises 77–92, use the graph to determine a. the function's domain; b. the function's range; c. the x-intercepts, if any; d. the y-intercept, if any; and e. the missing function values, indicated by question marks, below each graph.
In Exercises 77–92, use the graph to determine a. the function's domain; b. the function's range; c. the x-intercepts, if any; d. the y-intercept, if any; and e. the missing function values, indicated by question marks, below each graph.
Begin by graphing the absolute value function, f(x) = |x|. Then use transformations of this graph to graph the given function. h(x) = 2|x+3|