Ch. 2 - Functions and Graphs
Blitzer - College Algebra 8th Edition
Blitzer8th EditionCollege AlgebraISBN: 9780136970514당신이 사용하는 게 아니라요?교과서 변경
3장, 문제 72

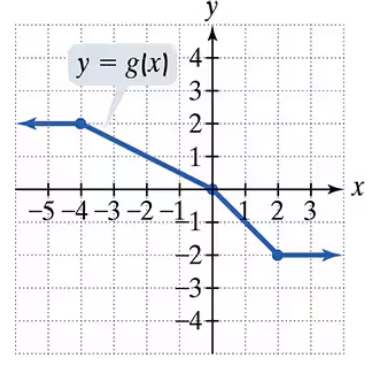
Use the graph of g to solve Exercises 71–76.

Find g(2)

검증된 단계별 안내
1
Identify the function g on the graph, which is represented by the red line with points marked.
Locate the x-value of 2 on the horizontal axis (x-axis).
From x = 2, move vertically upwards or downwards until you reach the point on the graph of g.
Determine the y-coordinate of the point on the graph directly above or below x = 2. This y-coordinate is the value of g(2).
Write the value of g(2) as the y-coordinate found in the previous step.

비슷한 문제에 대한 검증된 영상 답변:

이 영상 해법은 위 문제에 도움이 된다고 튜터들이 추천한 것입니다.
영상 길이:
1m
도움이 되었나요?

주요 개념

질문에 올바르게 답하기 위해 반드시 이해해야 하는 핵심 개념들은 다음과 같습니다.

Function Notation

Function notation, such as g(2), represents the output value of the function g when the input is 2. It is a way to denote the relationship between input values (domain) and output values (range) in a function.
추천 영상:
05:18
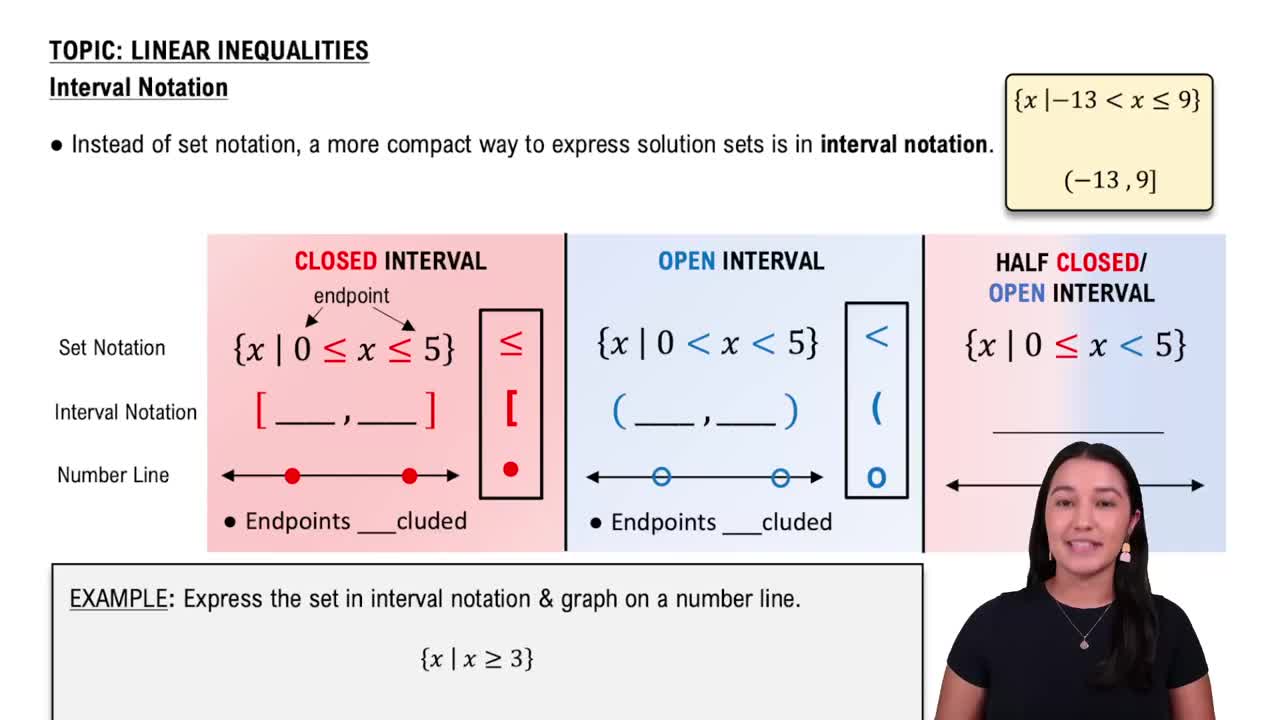
Interval Notation

Reading a Graph of a Function

To find g(2) from a graph, locate the input value 2 on the x-axis, then find the corresponding point on the graph. The y-coordinate of this point is the value of g(2). This process helps visualize how the function behaves.
추천 영상:
5:26
Graphs of Logarithmic Functions

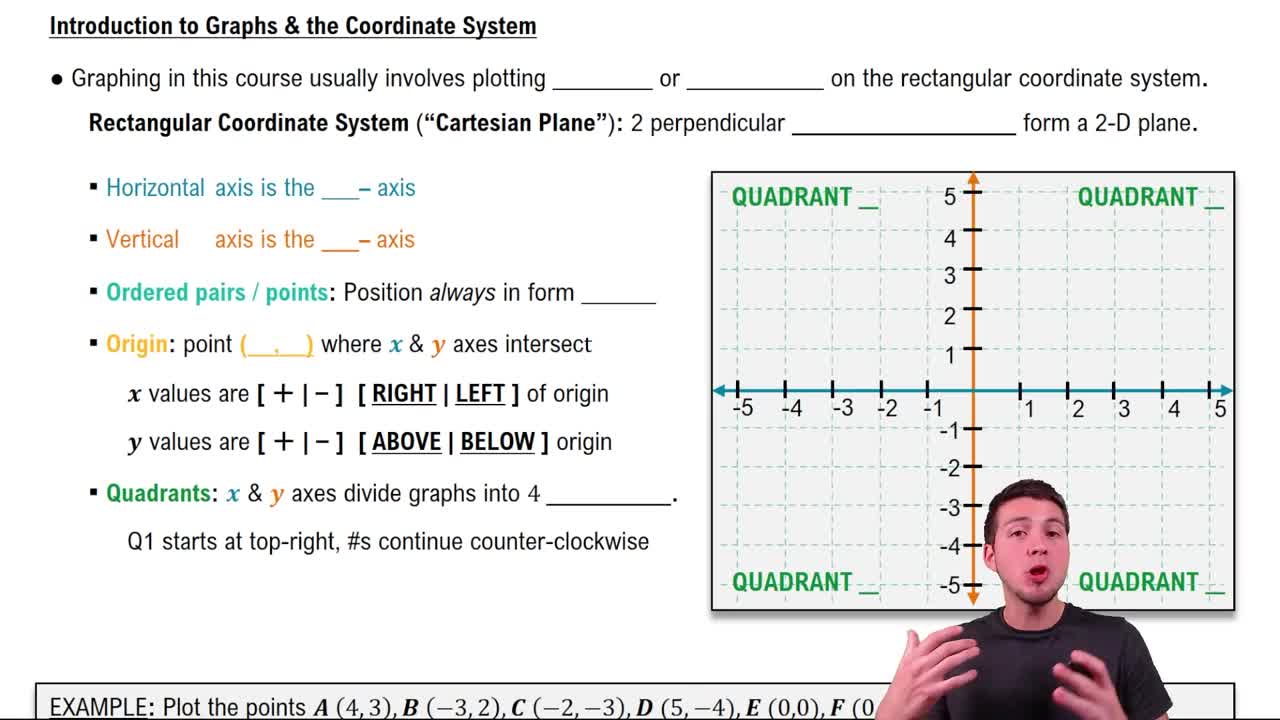
Coordinate Plane and Points

The coordinate plane consists of an x-axis (horizontal) and y-axis (vertical). Points on the graph are represented as (x, y), where x is the input and y is the output. Understanding how to interpret these points is essential for analyzing functions.
추천 영상:
가이드 코스
05:10
Graphs & the Rectangular Coordinate System