Use the Leading Coefficient Test to determine the end behavior of the graph of the polynomial function.
Ch. 3 - Polynomial and Rational Functions

4장, 문제 19
In Exercises 19–24, (a) Use the Leading Coefficient Test to determine the graph's end behavior. (b) Determine whether the graph has y-axis symmetry, origin symmetry, or neither. (c) Graph the function.
검증된 단계별 안내1
Identify the degree and leading coefficient of the polynomial function \(f(x) = x^3 - x^2 - 9x + 9\). The degree is the highest power of \(x\), which is 3, and the leading coefficient is the coefficient of \(x^3\), which is 1.
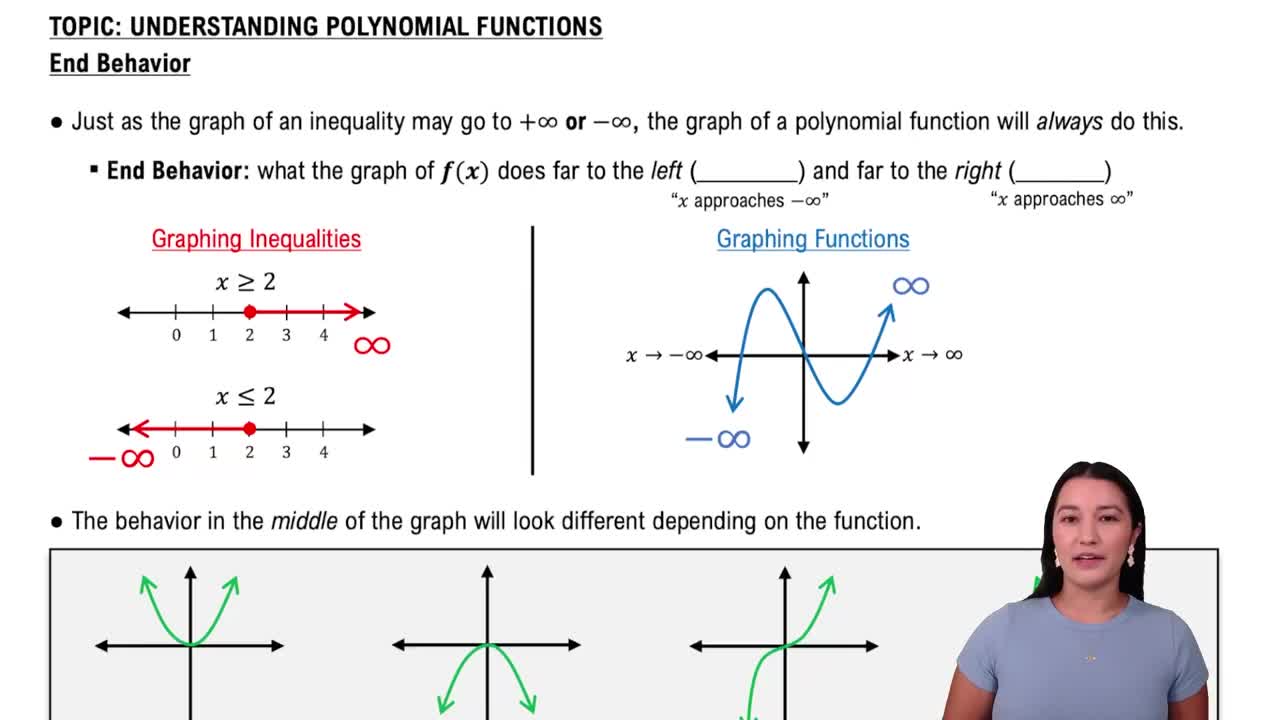
Apply the Leading Coefficient Test to determine the end behavior: Since the degree is odd (3) and the leading coefficient is positive (1), as \(x \to \infty\), \(f(x) \to \infty\), and as \(x \to -\infty\), \(f(x) \to -\infty\).
Check for symmetry by evaluating \(f(-x)\) and comparing it to \(f(x)\) and \(-f(x)\). Calculate \(f(-x) = (-x)^3 - (-x)^2 - 9(-x) + 9 = -x^3 - x^2 + 9x + 9\). Since \(f(-x) \neq f(x)\) and \(f(-x) \neq -f(x)\), the function has neither y-axis symmetry nor origin symmetry.
To graph the function, first find the x-intercepts by solving \(f(x) = 0\), which means solving \(x^3 - x^2 - 9x + 9 = 0\). Use factoring techniques or the Rational Root Theorem to find possible roots.
Next, find the y-intercept by evaluating \(f(0) = 9\). Plot the intercepts and use the end behavior and symmetry information to sketch the graph, noting the general shape of a cubic function with the given leading coefficient.

비슷한 문제에 대한 검증된 영상 답변:
이 영상 해법은 위 문제에 도움이 된다고 튜터들이 추천한 것입니다.
영상 길이:
5m도움이 되었나요?
주요 개념
질문에 올바르게 답하기 위해 반드시 이해해야 하는 핵심 개념들은 다음과 같습니다.
Leading Coefficient Test
The Leading Coefficient Test helps determine the end behavior of a polynomial function by examining the degree and the leading coefficient. For a cubic function, if the leading coefficient is positive, the graph falls to the left and rises to the right; if negative, it rises to the left and falls to the right.
추천 영상:
End Behavior of Polynomial Functions
Symmetry of Functions
Symmetry in graphs can be about the y-axis, origin, or neither. A function is symmetric about the y-axis if f(-x) = f(x) (even function), symmetric about the origin if f(-x) = -f(x) (odd function), and neither if neither condition holds. Checking symmetry helps understand the graph's shape.
추천 영상:
Function Composition
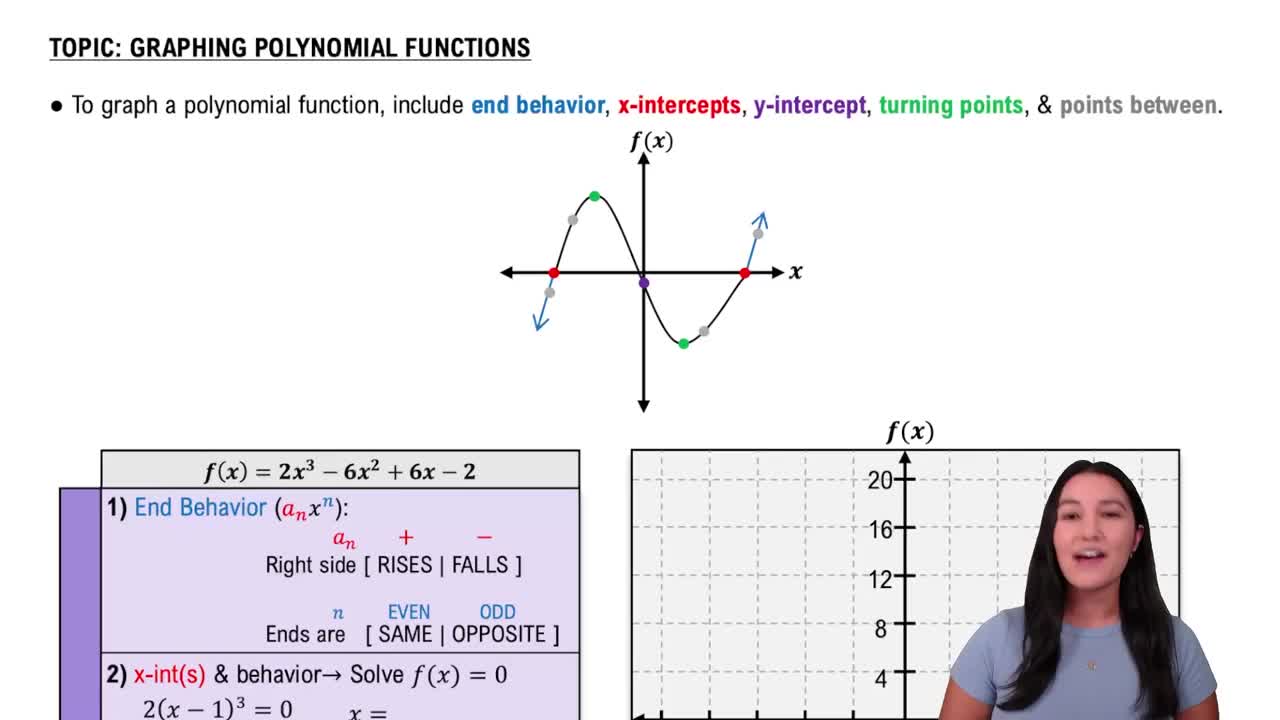
Graphing Polynomial Functions
Graphing involves plotting key points such as intercepts, turning points, and using end behavior and symmetry to sketch the curve. For cubic polynomials, identifying roots and behavior between them is essential to accurately represent the function's shape.
추천 영상:
Graphing Polynomial Functions
관련 실천
교과서 질문
660
views
교과서 질문
Divide using synthetic division. (3x2+7x−20)÷(x+5)
563
views
교과서 질문
Write an equation that expresses each relationship. Then solve the equation for y. x varies directly as z and inversely as the difference between y and w.
549
views
교과서 질문
In Exercises 19–24, (a) Use the Leading Coefficient Test to determine the graph's end behavior. (b) Determine whether the graph has y-axis symmetry, origin symmetry, or neither. (c) Graph the function.
1426
views
교과서 질문
In Exercises 17–24, a) List all possible rational roots. b) List all possible rational roots. c) Use the quotient from part (b) to find the remaining roots and solve the equation. x3−10x−12=0
863
views
교과서 질문
Write an equation that expresses each relationship. Then solve the equation for y. x varies directly as z and inversely as the sum of y and w.
571
views