Use the Leading Coefficient Test to determine the end behavior of the graph of the polynomial function.
Ch. 3 - Polynomial and Rational Functions

4장, 문제 20
Solve each polynomial inequality in Exercises 1–42 and graph the solution set on a real number line. Express each solution set in interval notation.
검증된 단계별 안내1
Start by writing the inequality: \(x^2 + 2x < 0\).
Factor the left-hand side expression: \(x^2 + 2x = x(x + 2)\).
Set the product less than zero: \(x(x + 2) < 0\). This means the product of two factors is negative.
Determine the critical points by setting each factor equal to zero: \(x = 0\) and \(x + 2 = 0 \Rightarrow x = -2\). These points divide the number line into intervals.
Test values from each interval \((-\infty, -2)\), \((-2, 0)\), and \((0, \infty)\) in the inequality \(x(x + 2) < 0\) to find where the product is negative, then express the solution set in interval notation.

비슷한 문제에 대한 검증된 영상 답변:
이 영상 해법은 위 문제에 도움이 된다고 튜터들이 추천한 것입니다.
영상 길이:
1m도움이 되었나요?
주요 개념
질문에 올바르게 답하기 위해 반드시 이해해야 하는 핵심 개념들은 다음과 같습니다.
Solving Polynomial Inequalities
Solving polynomial inequalities involves finding the values of the variable that make the inequality true. This typically requires factoring the polynomial, determining critical points where the expression equals zero, and testing intervals between these points to see where the inequality holds.
추천 영상:
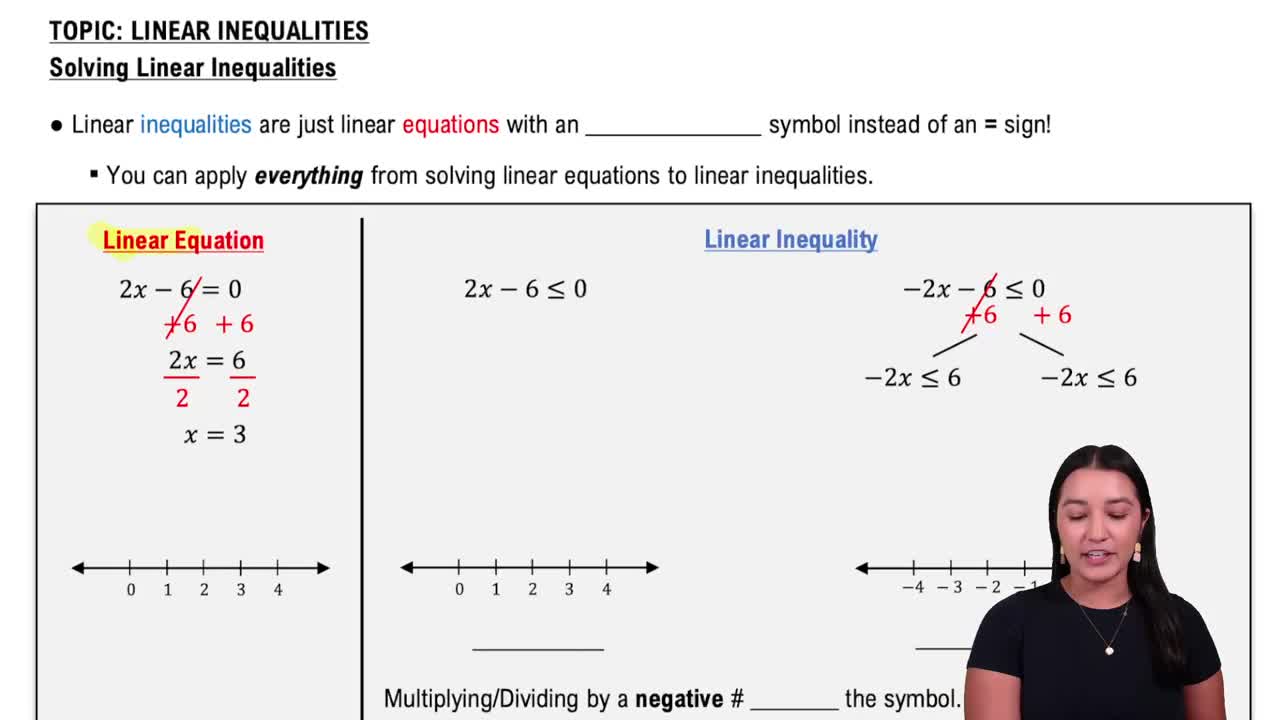
Linear Inequalities
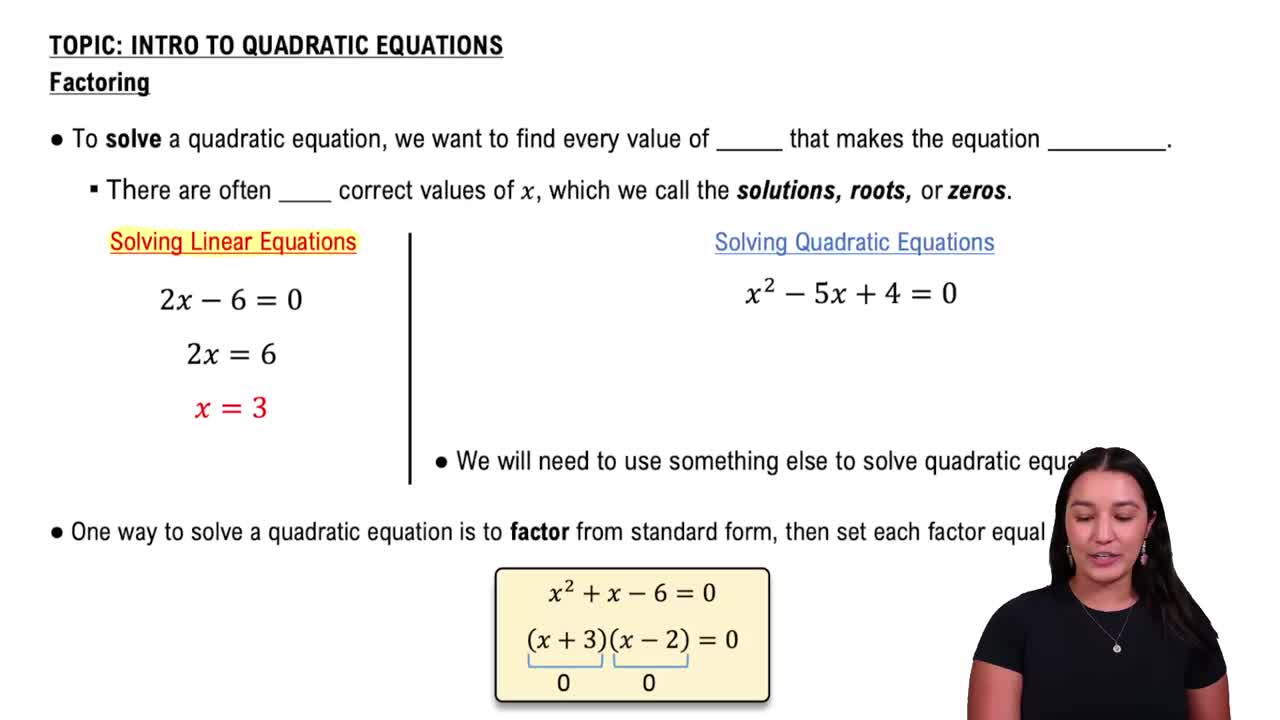
Factoring Quadratic Expressions
Factoring quadratic expressions means rewriting the quadratic as a product of two binomials. For example, x² + 2x can be factored as x(x + 2). Factoring helps identify the roots or zeros of the polynomial, which are essential for analyzing the inequality.
추천 영상:
Solving Quadratic Equations by Factoring
Interval Notation and Number Line Graphing
Interval notation is a way to represent solution sets using intervals, such as (a, b) or [a, b), indicating which numbers satisfy the inequality. Graphing on a number line visually shows these intervals, helping to understand where the polynomial is positive or negative.
추천 영상:
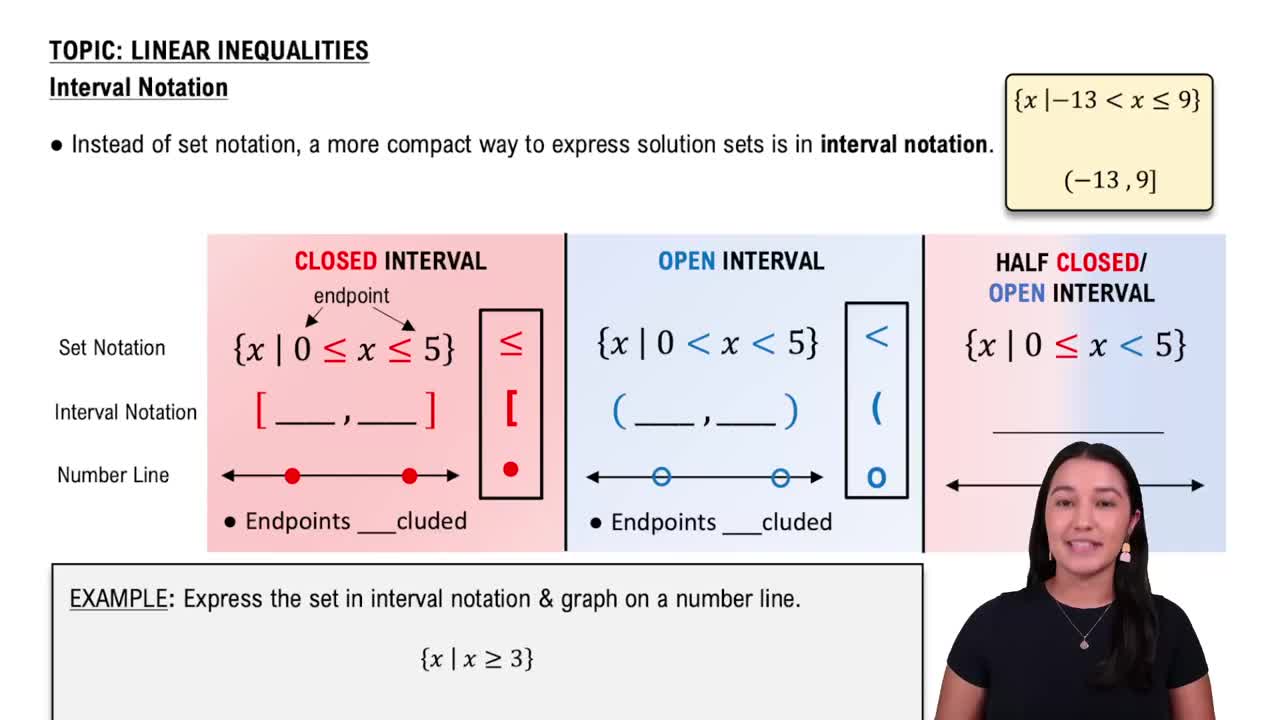
Interval Notation
관련 실천
교과서 질문
660
views
교과서 질문
Divide using synthetic division. (4x3−3x2+3x−1)÷(x−1)
554
views
교과서 질문
In Exercises 19–24, (a) Use the Leading Coefficient Test to determine the graph's end behavior. (b) Determine whether the graph has y-axis symmetry, origin symmetry, or neither. (c) Graph the function.
1426
views
교과서 질문
Use the Leading Coefficient Test to determine the end behavior of the graph of the polynomial function.
549
views
교과서 질문
Use the vertex and intercepts to sketch the graph of each quadratic function. Give the equation of the parabola's axis of symmetry. Use the graph to determine the function's domain and range. y−1=(x−3)2
621
views
교과서 질문
Write an equation that expresses each relationship. Then solve the equation for y. x varies directly as z and inversely as the sum of y and w.
571
views