Ch. 5 - Systems of Equations and Inequalities
Blitzer - College Algebra 8th Edition
Blitzer8th EditionCollege AlgebraISBN: 9780136970514당신이 사용하는 게 아니라요?교과서 변경
6장, 문제 53

In Exercises 27–62, graph the solution set of each system of inequalities or indicate that the system has no solution. x2+y2≤1, y−x2>0
Graph showing the solution set for the inequalities x^2 + y^2 ≤ 16 and y - x^2 > -4.

검증된 단계별 안내
1
Step 1: Identify the inequalities in the system. The first inequality is x2 + y2 \(\leq\) 16, which represents all points (x, y) inside or on the circle centered at the origin with radius 4, since \( \sqrt{16} = 4 \).
Step 2: The second inequality is y - x^2 > -4. Rearranging this, we get y > x^2 - 4. This represents the region above the parabola y = x^2 - 4.
Step 3: To graph the solution set, first draw the circle x^2 + y^2 = 16. Shade the interior and the boundary because of the 'less than or equal to' sign.
Step 4: Next, graph the parabola y = x^2 - 4. Since the inequality is strict (greater than), shade the region above this parabola, not including the parabola itself.
Step 5: The solution set to the system is the intersection of the two shaded regions: points inside or on the circle and above the parabola. Identify this overlapping region on the graph as the solution set.

비슷한 문제에 대한 검증된 영상 답변:

이 영상 해법은 위 문제에 도움이 된다고 튜터들이 추천한 것입니다.
영상 길이:
8m

주요 개념

질문에 올바르게 답하기 위해 반드시 이해해야 하는 핵심 개념들은 다음과 같습니다.

Graphing Inequalities in Two Variables

Graphing inequalities involves shading regions of the coordinate plane that satisfy the inequality. For example, the inequality x² + y² ≤ 16 represents all points inside or on the circle centered at the origin with radius 4. Understanding how to graph such regions is essential for visualizing solution sets.
추천 영상:
05:28
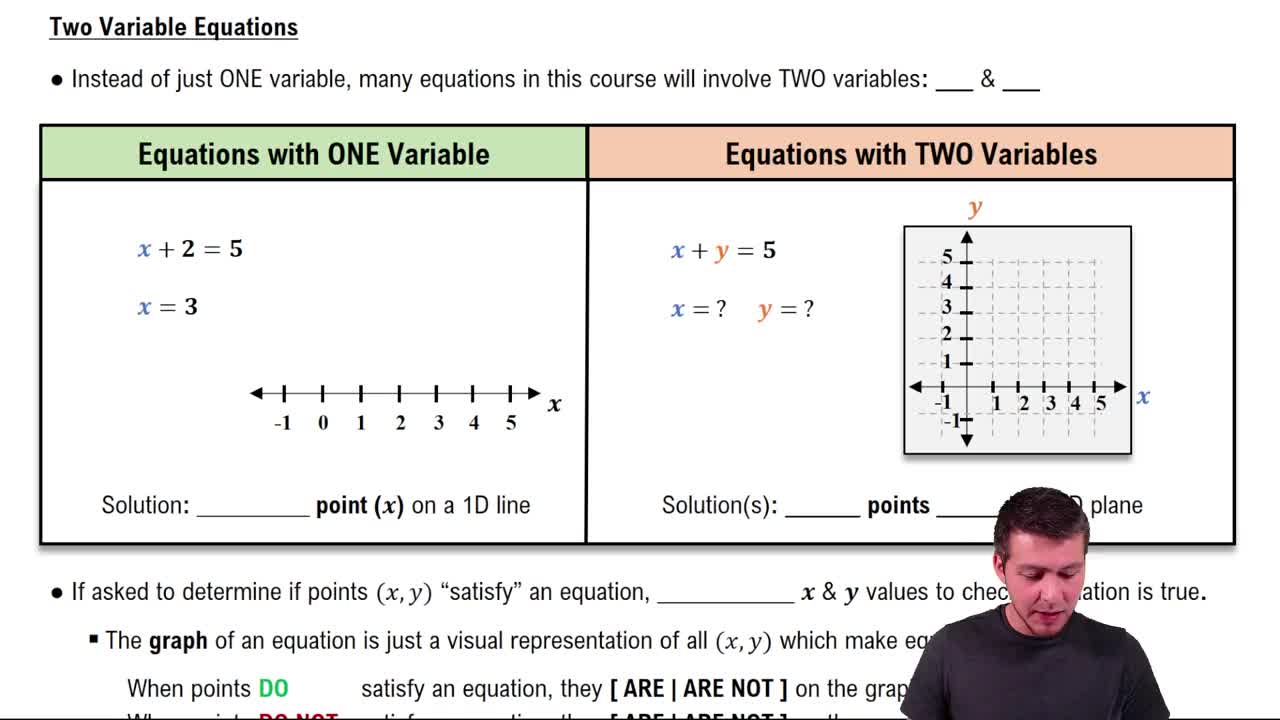
Equations with Two Variables

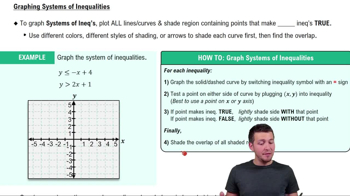
Systems of Inequalities

A system of inequalities requires finding the intersection of solution sets for each inequality. The solution to the system is the region where all inequalities overlap. This concept is crucial for determining the combined feasible region that satisfies all given conditions.
추천 영상:
6:19
Systems of Inequalities

Quadratic Functions and Their Graphs

Quadratic functions like y = x² produce parabolas. Inequalities involving quadratics, such as y - x² > -4, describe regions relative to these parabolas. Recognizing the shape and position of these graphs helps in accurately shading the solution regions.
추천 영상:
5:26
Graphs of Logarithmic Functions