Ch. 5 - Systems of Equations and Inequalities
Blitzer - College Algebra 8th Edition
Blitzer8th EditionCollege AlgebraISBN: 9780136970514당신이 사용하는 게 아니라요?교과서 변경
6장, 문제 43

Graph the solution set of each system of inequalities or indicate that the system has no solution.
{x+y>4x+y>1\(\begin{cases}\) x + y > 4 \\ x + y > -1 \(\end{cases}\)

검증된 단계별 안내
1
Start by examining each inequality separately. The system is: \[\begin{cases} 2x - y > 4 \\ 2x - y > -5 \end{cases}\]
Rewrite each inequality in terms of \(y\) to better understand the boundary lines: For the first inequality: \[2x - y > 4 \implies -y > 4 - 2x \implies y < 2x - 4\] For the second inequality: \[2x - y > -5 \implies -y > -5 - 2x \implies y < 2x + 5\]
Graph the boundary lines \(y = 2x - 4\) and \(y = 2x + 5\). Since the inequalities are strict (greater than), these lines will be dashed to indicate points on the line are not included.
Determine the solution region for each inequality: - For \(y < 2x - 4\), shade the region below the line \(y = 2x - 4\). - For \(y < 2x + 5\), shade the region below the line \(y = 2x + 5\).
The solution to the system is the intersection of these two shaded regions. Since \(2x - 4\) is always less than \(2x + 5\) for all \(x\), the region below \(y = 2x - 4\) is contained within the region below \(y = 2x + 5\). Therefore, the solution set is all points below the line \(y = 2x - 4\).

비슷한 문제에 대한 검증된 영상 답변:

이 영상 해법은 위 문제에 도움이 된다고 튜터들이 추천한 것입니다.
영상 길이:
3m

주요 개념

질문에 올바르게 답하기 위해 반드시 이해해야 하는 핵심 개념들은 다음과 같습니다.

Graphing Linear Inequalities

Graphing linear inequalities involves plotting the boundary line given by the corresponding linear equation and then shading the region that satisfies the inequality. The boundary line is dashed if the inequality is strict (>, <) and solid if it includes equality (≥, ≤). This visual representation helps identify all points that satisfy the inequality.
추천 영상:
06:07
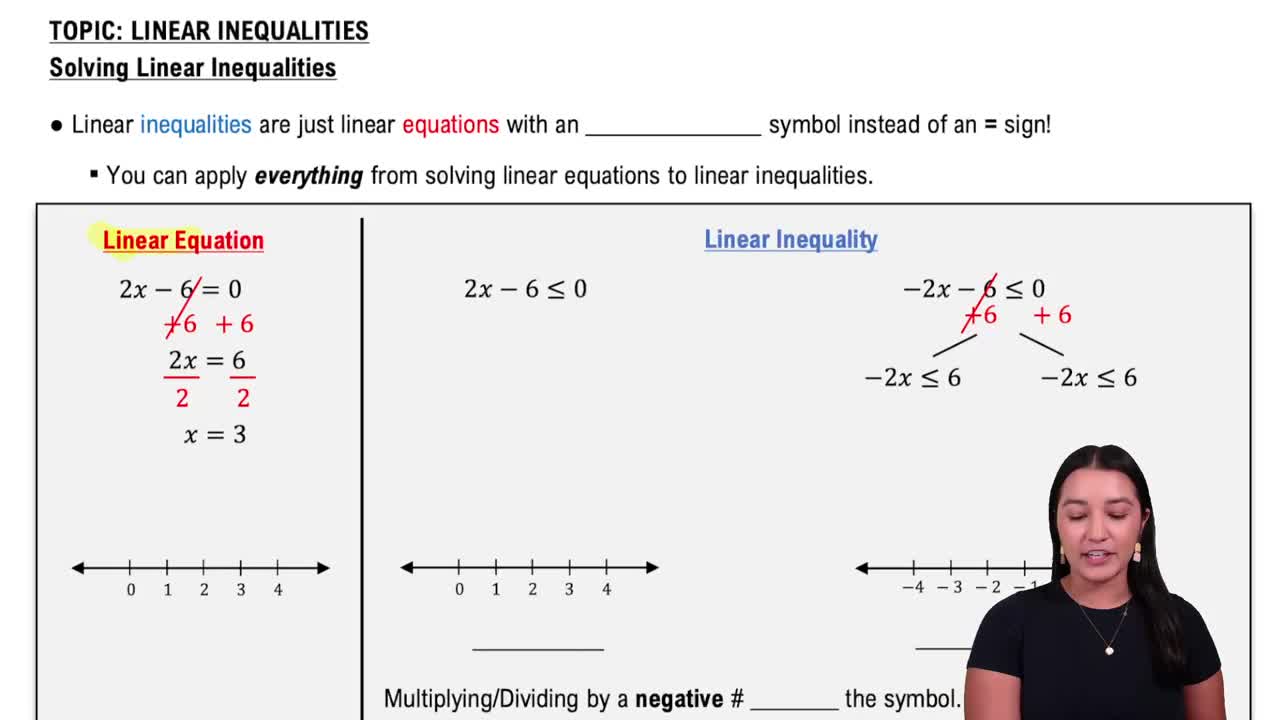
Linear Inequalities

System of Inequalities

A system of inequalities consists of two or more inequalities considered simultaneously. The solution set is the intersection of the regions satisfying each inequality. Graphing each inequality and finding the overlapping shaded region reveals the solution set, or shows if no solution exists when regions do not overlap.
추천 영상:
6:19
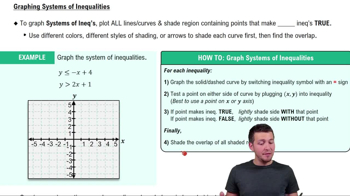
Systems of Inequalities

Slope-Intercept Form and Boundary Lines

Rearranging inequalities into slope-intercept form (y = mx + b) helps graph the boundary lines easily. For example, 2x - y > 4 can be rewritten as y < 2x - 4. Understanding the slope and y-intercept allows accurate drawing of the boundary line, which is essential for correctly shading the solution region.
추천 영상:
02:35
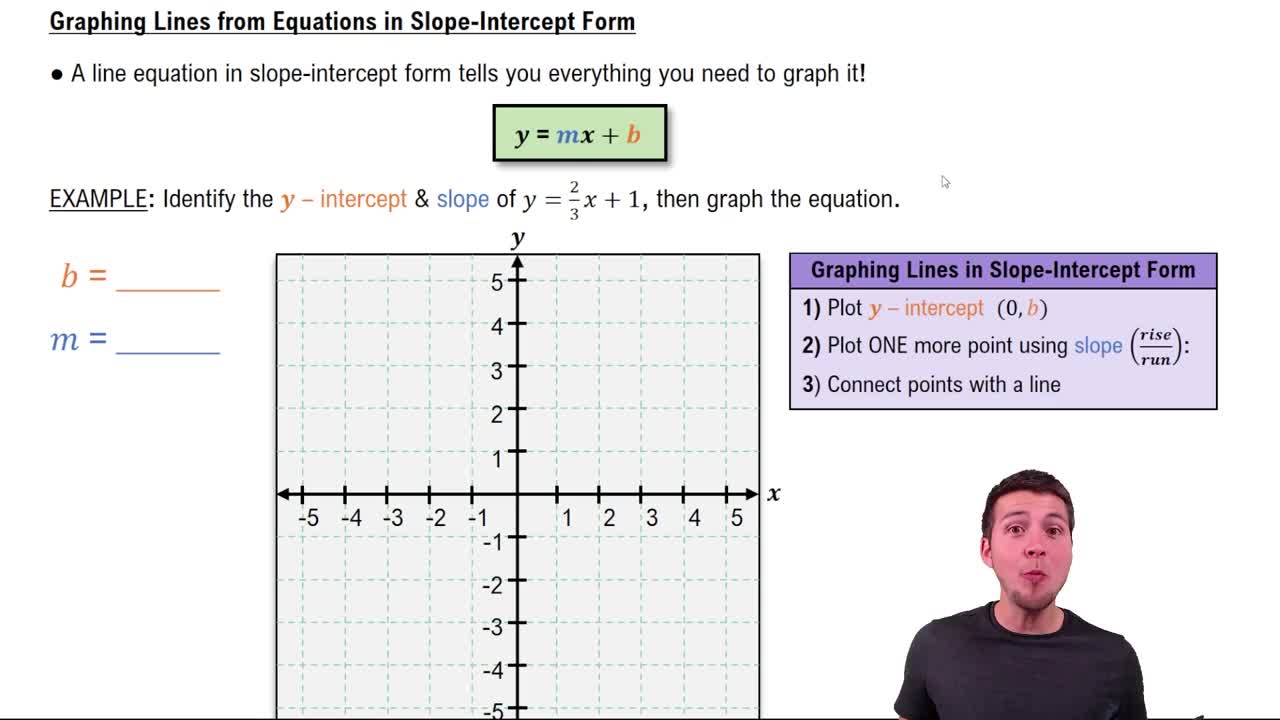
Graphing Lines in Slope-Intercept Form