Ch. 8 - Sequences, Induction, and Probability
Blitzer - College Algebra 8th Edition
Blitzer8th EditionCollege AlgebraISBN: 9780136970514당신이 사용하는 게 아니라요?교과서 변경
9장, 문제 64

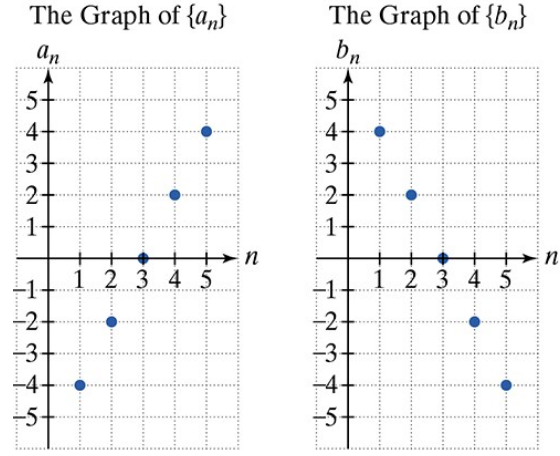
In Exercises 61–68, use the graphs of and to find each indicated sum.
Two scatter plots showing sequences with points at n=1 to 5 and corresponding values on vertical axes from -5 to 5.
i=15(ai+3bi)\(\sum\)_{i=1}^5(a_{i}+3b_{i})

검증된 단계별 안내
1
Step 1: Identify the values of the sequences \(a_n\) and \(b_n\) for \(n = 1, 2, 3, 4, 5\) from the graphs. For \(a_n\), read the y-values of the points at \(n=1, 2, 3, 4, 5\). For \(b_n\), do the same for the corresponding \(n\) values.
Step 2: Write down the values explicitly. For example, \(a_1 = \text{value from graph}\), \(a_2 = \text{value from graph}\), and so on, similarly for \(b_1, b_2, b_3, b_4, b_5\).
Step 3: Calculate each term inside the summation \(a_i + 3b_i\) for \(i = 1, 2, 3, 4, 5\). This means multiply each \(b_i\) by 3 and then add the corresponding \(a_i\).
Step 4: Sum all the calculated terms from Step 3 to find \(\sum_{i=1}^5 (a_i + 3b_i)\). This involves adding the five values obtained for each \(i\).
Step 5: Write the final expression for the sum, showing the addition of all terms explicitly, but do not compute the numerical total as per instructions.

비슷한 문제에 대한 검증된 영상 답변:

이 영상 해법은 위 문제에 도움이 된다고 튜터들이 추천한 것입니다.
영상 길이:
4m

주요 개념

질문에 올바르게 답하기 위해 반드시 이해해야 하는 핵심 개념들은 다음과 같습니다.

Sequences and Terms

A sequence is an ordered list of numbers, where each number is called a term. The term a_n represents the nth term of sequence a, and similarly b_n for sequence b. Understanding how to identify and interpret terms from graphs is essential for working with sequences.
추천 영상:
8:22
Introduction to Sequences

Summation Notation (Sigma Notation)

Summation notation, represented by the Greek letter sigma (Σ), is a concise way to express the sum of a sequence of terms. For example, Σ from i=1 to 5 of (a_i + 3b_i) means adding the values of a_i plus three times b_i for i = 1 through 5.
추천 영상:
05:18
Interval Notation

Using Graphs to Extract Sequence Values

Graphs of sequences plot term indices on the x-axis and term values on the y-axis. To find specific terms like a_i or b_i, locate the point at x = i and read the corresponding y-value. This skill is crucial for evaluating sums involving terms from graphical data.
추천 영상:
5:31
Graphing Rational Functions Using Transformations