Ch. 4 - Inverse, Exponential, and Logarithmic Functions
Lial - College Algebra 13th Edition
Lial13th EditionCollege AlgebraISBN: 9780136881063당신이 사용하는 게 아니라요?교과서 변경
5장, 문제 31

Graph each function. See Example 2. ƒ(x) = (3/2)x

검증된 단계별 안내
1
Identify the type of function given. Since the function is ƒ(x) = \(\left\)(\(\frac{3}{2}\)\(\right\))^x, it is an exponential function with base \(\frac{3}{2}\), which is greater than 1, indicating exponential growth.
Create a table of values by choosing several values for x (for example, -2, -1, 0, 1, 2) and calculate the corresponding y-values using the function ƒ(x) = \(\left\)(\(\frac{3}{2}\)\(\right\))^x. Remember to apply the exponent rules carefully.
Plot the points from the table on the coordinate plane. Each point will have coordinates (x, ƒ(x)) based on your calculations.
Draw a smooth curve through the plotted points, making sure the graph approaches the x-axis but never touches it (this is the horizontal asymptote y = 0), and that the curve increases as x increases because the base is greater than 1.
Label the graph with the function equation and the asymptote y = 0 to clearly show the behavior of the exponential function.

비슷한 문제에 대한 검증된 영상 답변:

이 영상 해법은 위 문제에 도움이 된다고 튜터들이 추천한 것입니다.
영상 길이:
5m
도움이 되었나요?

주요 개념

질문에 올바르게 답하기 위해 반드시 이해해야 하는 핵심 개념들은 다음과 같습니다.

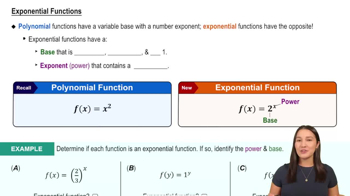
Exponential Functions

An exponential function has the form f(x) = a^x, where the base a is a positive constant not equal to 1. It models growth or decay processes, and its graph shows rapid increase or decrease depending on the base. Understanding the behavior of exponential functions is essential for graphing them accurately.
추천 영상:
6:13
Exponential Functions

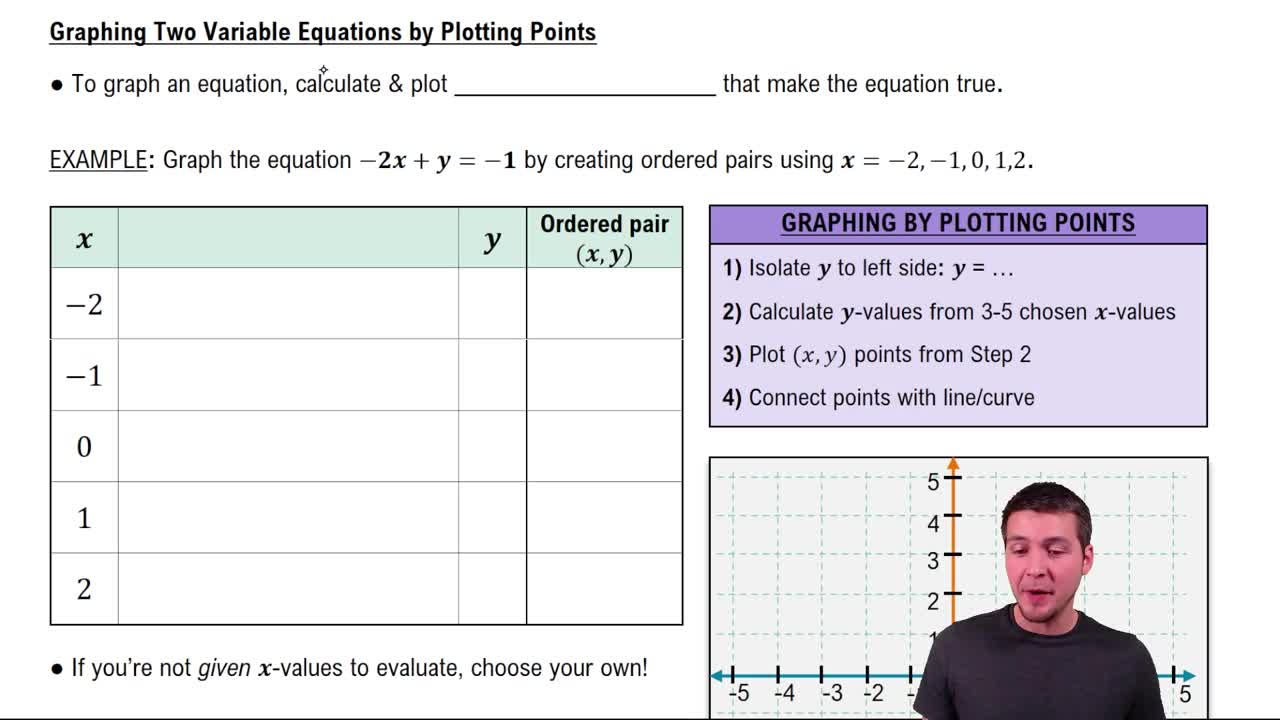
Plotting Points for Graphing

To graph a function like f(x) = (3/2)^x, calculate and plot points by substituting various x-values and finding corresponding y-values. This helps visualize the curve and identify key features such as intercepts and growth trends. Plotting points is a fundamental step in graphing any function.
추천 영상:
가이드 코스
04:29
Graphing Equations of Two Variables by Plotting Points

Asymptotes and End Behavior

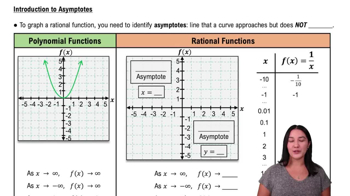
Exponential functions have a horizontal asymptote, usually the x-axis (y=0), which the graph approaches but never touches. Understanding this helps predict the function's behavior for large positive or negative x-values, showing how the function grows or decays without bound.
추천 영상:
6:24
Introduction to Asymptotes