 뒤로
뒤로CFA Quantitative Methods and Economics: Mini-Textbook Study Notes
스터디 가이드 - 스마트 노트
 자료에 맞춘 맞춤형 노트, 핵심 정의, 예시, 맥락을 확장해 제공합니다.
Rates and Returns
Interest Rates and Return Measurement
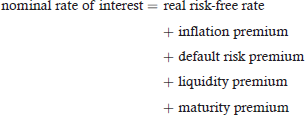
Interest rates are fundamental in finance, representing the cost of borrowing or the reward for saving. They can be interpreted as required rates of return, discount rates, or opportunity costs. The nominal rate of interest is composed of several components:
Real risk-free rate: The return in the absence of inflation and risk.
Inflation premium: Compensation for expected inflation.
Default risk premium: Compensation for the risk of default.
Liquidity premium: Compensation for the risk of not being able to sell the asset quickly at fair value.
Maturity premium: Compensation for the risk associated with longer maturities.
Example: U.S. Treasury bills are considered to have a nominal risk-free rate, as they include an inflation premium but are free from default and liquidity risk.
Return Measurement Approaches
Returns can be measured in several ways, each appropriate for different contexts:
Holding Period Return (HPR): The percentage increase in value over a period.
Arithmetic Mean Return: The simple average of periodic returns.
Geometric Mean Return: The compound rate of return over multiple periods.
Harmonic Mean: Used for averaging prices or rates, especially when averaging cost per share over time.
Example (Geometric Mean):
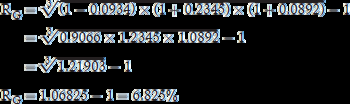
Key Point: The geometric mean is always less than or equal to the arithmetic mean, especially as return variability increases.
Money-Weighted vs. Time-Weighted Returns
Two principal methods are used to evaluate portfolio performance:
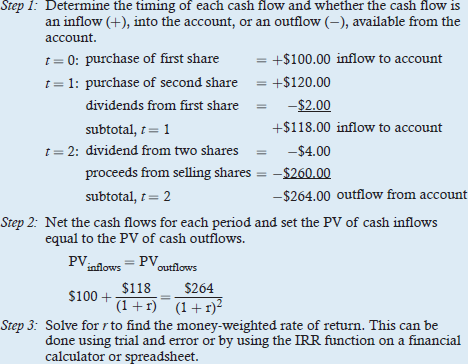
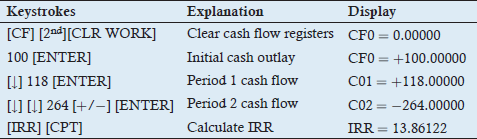
Money-Weighted Return (MWR): Equivalent to the internal rate of return (IRR), it accounts for the timing and amount of cash flows.
Time-Weighted Return (TWR): Measures compound growth, neutralizing the impact of cash flow timing.
Example (MWR Calculation):
Example (TWR Calculation):
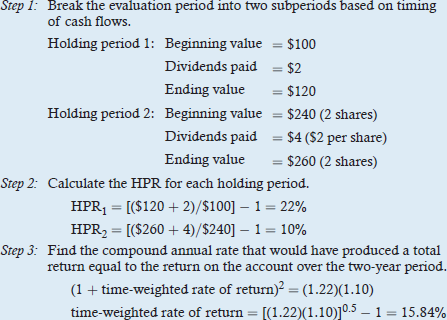
Key Point: TWR is preferred for evaluating investment managers, as it removes the effect of cash flow timing, which is often outside the manager's control.
Annualized and Continuously Compounded Returns
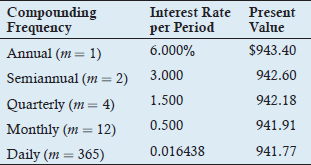
Returns are often annualized for comparability. The effect of compounding frequency is significant in present and future value calculations:
More frequent compounding increases the effective interest rate.
Continuously compounded returns use the natural logarithm and are additive over time.
The Time Value of Money in Finance
Discounted Cash Flow Valuation
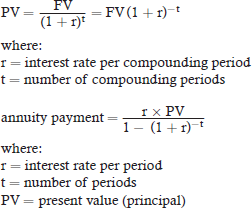
The present value (PV) of a future cash flow is calculated as:
$PV = \frac{FV}{(1 + r)^t} = FV (1 + r)^{-t}$
For annuities:
$\text{Annuity payment} = \frac{r \times PV}{1 - (1 + r)^{-t}}$
Example: Zero-coupon bonds, coupon bonds, and perpetuities are valued using these formulas.
Forward Rates and the Additivity Principle
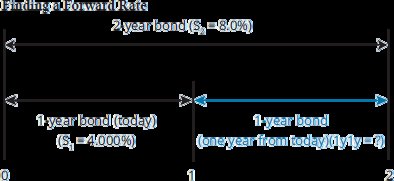
The cash flow additivity principle states that the PV of a series of cash flows is the sum of the PVs of the individual cash flows. This underpins the no-arbitrage condition in finance.
Example (Forward Rate Calculation):
Statistical Measures of Asset Returns
Central Tendency and Dispersion
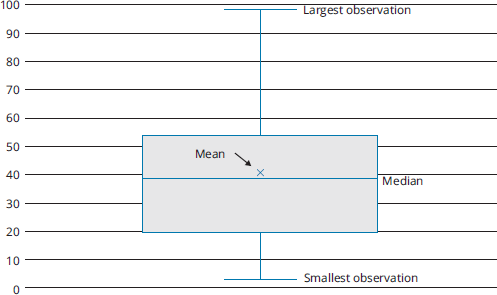
Measures of central tendency (mean, median, mode) and dispersion (range, variance, standard deviation) are essential for analyzing investment returns.
Box and Whisker Plot: Visualizes the distribution, showing mean, median, and range.
Downside Risk and Target Deviation
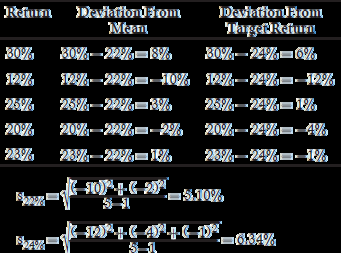
Downside risk focuses on returns below a target. Target downside deviation is calculated similarly to standard deviation but only includes returns below the target.
Skewness and Kurtosis
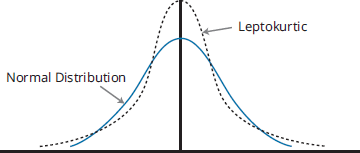
Skewness measures asymmetry; kurtosis measures the 'peakedness' and tail risk of a distribution.
Leptokurtic: More peaked, fatter tails than normal.
Correlation and Covariance
Correlation quantifies the linear relationship between two variables, ranging from -1 to +1. Covariance measures the direction of the relationship but is not standardized.
Scatter Plots: Visualize relationships between variables.
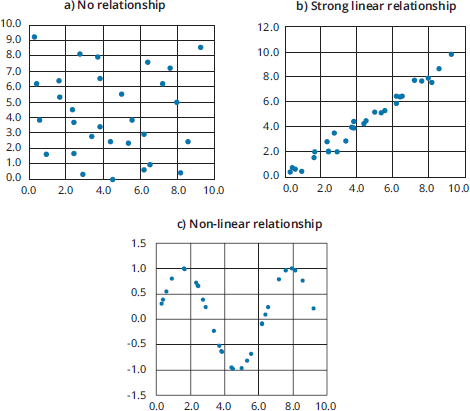
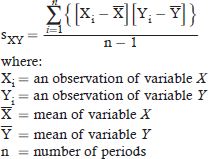
Key Point: Correlation does not imply causation; outliers and spurious correlations must be considered.
*Additional info: These notes are based on the CFA curriculum's Quantitative Methods and Economics sections, which are foundational for financial accounting and investment analysis. The images included are directly relevant to the mathematical and statistical concepts discussed.*
