 뒤로
뒤로Cost Behavior, CVP Analysis, and Operating Leverage – Financial Accounting Study Guidance
스터디 가이드 - 스마트 노트
 자료에 맞춘 맞춤형 노트, 핵심 정의, 예시, 맥락을 확장해 제공합니다.
Q1. Fixed- and Variable-Cost Behavior: Napco Plant Cleaning
Background
Topic: Cost Behavior (Fixed vs. Variable Costs)
This question tests your understanding of how fixed and variable costs behave as activity levels change, and how to predict total and per-unit costs for different scenarios. It also involves preparing a cost schedule and comparing in-house vs. outsourced cleaning options.

Key Terms and Formulas
Fixed Cost: A cost that does not change with the level of activity (e.g., labor cost if workers are salaried).
Variable Cost: A cost that changes in direct proportion to activity (e.g., cleaning supplies per cleaning).
Total Cost:
Cost per Cleaning:
Step-by-Step Guidance
Identify the fixed and variable costs from the scenario: labor cost is fixed, cleaning supplies are variable.
Calculate the variable cost per cleaning by dividing the total cleaning supplies cost by the number of cleanings in March.
For each month in the next quarter (5, 6, and 8 cleanings), compute the total labor cost (which remains constant) and the total cleaning supplies cost (which varies with the number of cleanings).
Sum the labor and cleaning supplies costs to get the total cost for each month, and then calculate the cost per cleaning for each scenario.
Set up a table to organize your results, but do not sum the total for the quarter yet. Pause here and try to complete the calculations yourself!
Try solving on your own before revealing the answer!
Final Answer:
The table and calculations are as follows:
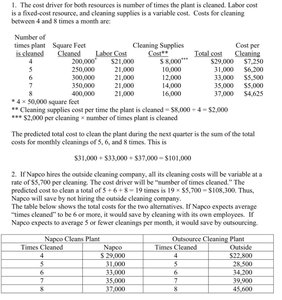
The predicted total cost for the next quarter is $101,000 (sum of $33,000, $37,000, and $31,000 for 5, 6, and 8 cleanings, respectively).
For outsourcing, multiply the number of cleanings by the outside rate ($5,700) and compare to in-house costs. The schedule shows outsourcing would cost $114,000, which is higher than in-house cleaning ($101,000), so Napco would not save money by outsourcing.
Q2. Cost-Volume-Profit at a Hospital
Background
Topic: Cost-Volume-Profit (CVP) Analysis
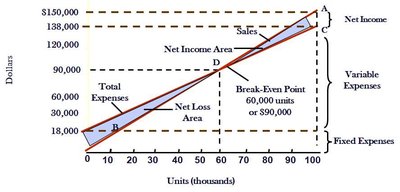
This question tests your ability to calculate the break-even point and analyze profit under different cost scenarios using the CVP model. It involves understanding fixed costs, variable costs, and contribution margin ratio.
Key Terms and Formulas
Break-even Point (in revenue):
Contribution Margin Ratio (CMR):
Profit:
Step-by-Step Guidance
Calculate the contribution margin ratio by subtracting the variable cost ratio from 1.
Divide the fixed costs by the contribution margin ratio to find the break-even point in total revenue.
For the profit calculation, subtract variable costs (70% of revenue) and fixed costs from total revenue for part (a).
For part (b), increase variable costs by 10% and repeat the profit calculation.
Pause here and try to complete the calculations for both scenarios before checking the answer!
Try solving on your own before revealing the answer!
Final Answer:

1. The break-even point in total revenue is $140,000,000.
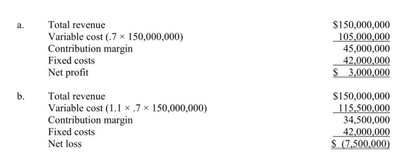
2. a) Expected profit if costs behave as expected is $3,000,000. b) If variable costs are 10% greater than predicted, the hospital will have a net loss of $7,500,000.
Q3. Basic CVP Relationships, Restaurant
Background
Topic: Cost-Volume-Profit (CVP) Analysis in a Service Business
This question asks you to apply CVP analysis to a restaurant scenario, including break-even analysis, profit planning, and the impact of changes in price, costs, and customer volume.
Key Terms and Formulas
Break-even Point (in units):
Unit Contribution Margin:
Profit Equation:
Step-by-Step Guidance
Set up the profit equation using the given sales price, variable cost, and fixed costs to solve for the number of meals needed for a target profit.
Calculate the break-even point by setting profit to zero and solving for the number of meals.
Adjust the equation for changes in price or variable cost as described in the question, and solve for the new required sales volume.
For scenarios involving changes in customer volume or fixed costs, update the relevant values in your equations and recalculate profit or required sales.
Pause here and try to solve each part before checking the answer!
Try solving on your own before revealing the answer!
Final Answer:
1. 3,000 meals for $8,500 profit. 2. Break-even at 2,000 meals. 3. 3,200 meals needed if price increases to $22 and variable cost to $11.40. 4. Profit with 15% fewer customers and 3,000 meals is $1,610. 5. If fixed costs increase by $2,300 and sales increase by 250 meals, profit increases by $350.
Q4. Cost-Volume-Profit and Vending Machines
Background
Topic: CVP Analysis for Product Sales
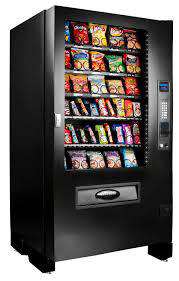
This question involves calculating break-even points, analyzing the effect of increased sales, and understanding the impact of changes in contribution margin for a vending machine business.
Key Terms and Formulas
Break-even Point (in units):
Contribution Margin per Unit:
Profit Calculation:
Step-by-Step Guidance
Calculate the unit contribution margin using the selling price and variable cost per snack.
Divide the total fixed costs by the unit contribution margin to find the break-even point in units.
For sales in dollars, divide fixed costs by the contribution margin percentage.
To analyze the effect of increased sales, multiply the additional units by the contribution margin and add to the previous profit calculation.
Pause here and try to complete the calculations for each part before checking the answer!
Try solving on your own before revealing the answer!
Final Answer:
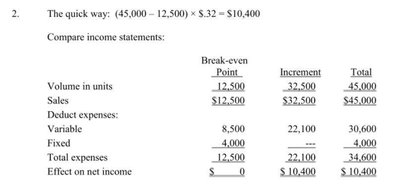
1. Break-even point is 12,500 units or $12,500 in sales. 2. Net income for 45,000 units is $10,400. 3. Break-even point for $0.75 variable cost is 16,000 units or $16,000 in sales. 4. Net income for 45,000 units at new variable cost is $6,825.
Q5. Operating Leverage at eBay
Background
Topic: Operating Leverage and Cost Structure
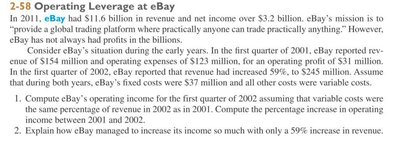
This question explores how changes in sales affect operating income, especially when a company has high fixed costs and low variable costs. It demonstrates the concept of operating leverage.
Key Terms and Formulas
Operating Income:
Variable Cost Ratio:
Operating Leverage: The sensitivity of operating income to changes in sales, higher when fixed costs are a larger proportion of total costs.
Step-by-Step Guidance
Calculate the variable cost percentage for 2001 using the given expenses and fixed costs.
Apply the same percentage to 2002 revenue to estimate variable costs for 2002.
Subtract variable and fixed costs from 2002 revenue to find operating income for 2002.
Compare the percentage increase in operating income to the percentage increase in revenue to illustrate operating leverage.
Pause here and try to complete the calculations and reasoning before checking the answer!
Try solving on your own before revealing the answer!
Final Answer:

1. Operating income for 2002 is $71.2 million, a 130% increase over 2001. 2. The large increase in income with only a 59% increase in revenue is due to operating leverage: fixed costs remain constant, so additional sales contribute more to operating income.
