 뒤로
뒤로Quantitative Methods and Economics: Mini-Textbook Study Notes (CFA Level I)
스터디 가이드 - 스마트 노트
 자료에 맞춘 맞춤형 노트, 핵심 정의, 예시, 맥락을 확장해 제공합니다.
Rates and Returns
Interest Rates and Return Measurement
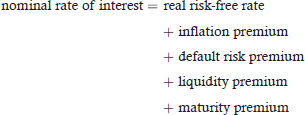
Interest rates are fundamental in finance, representing the cost of borrowing or the reward for saving. They can be interpreted as required rates of return, discount rates, or opportunity costs. The nominal rate of interest is composed of several components:
Real risk-free rate: Compensation for deferring consumption.
Inflation premium: Compensation for expected inflation.
Default risk premium: Compensation for the risk of borrower default.
Liquidity premium: Compensation for the risk of not being able to sell the asset quickly at fair value.
Maturity premium: Compensation for the increased risk of longer-term investments.
Key Formula:
$ \text{nominal rate of interest} = \text{real risk-free rate} + \text{inflation premium} + \text{default risk premium} + \text{liquidity premium} + \text{maturity premium} $
Return Measurement Approaches
Holding Period Return (HPR): Measures the percentage increase in value of an investment over a period.
Arithmetic Mean Return: Simple average of periodic returns; unbiased estimator of the true mean.
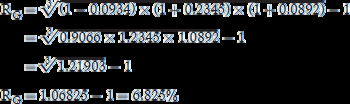
Geometric Mean Return: Compound rate of return over multiple periods; always less than or equal to the arithmetic mean unless all returns are equal.
Harmonic Mean: Used for averaging prices when equal amounts are invested periodically.
Example: Geometric Mean Return Calculation
Key Formula:
$ R_{G} = \sqrt[3]{(1-0.0934) \times (1+0.2345) \times (1+0.0892)} - 1 $
Money-Weighted vs. Time-Weighted Returns
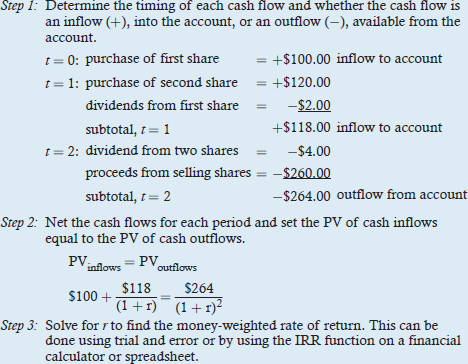
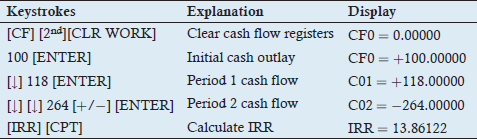
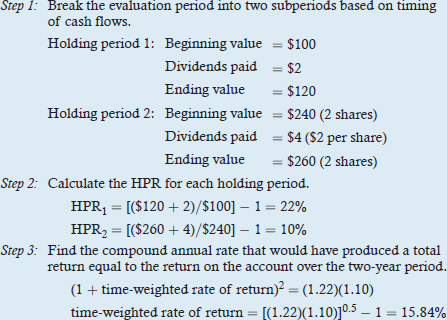
The money-weighted return is the internal rate of return (IRR) on a portfolio, accounting for all cash inflows and outflows. The time-weighted return measures compound growth, removing the effect of cash flow timing and is preferred for evaluating investment managers.
Money-Weighted Return Example:
Time-Weighted Return Example:
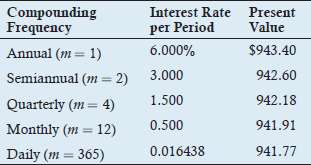
Effect of Compounding Frequency
Increasing the frequency of compounding increases the effective interest rate, which increases future value and decreases present value.
The Time Value of Money in Finance
Present Value and Annuity Calculations
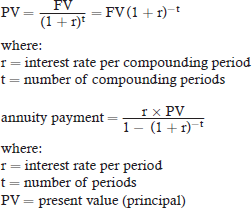
The present value (PV) of a future cash flow is calculated by discounting it at the appropriate interest rate. An annuity is a series of equal payments made at regular intervals.
Key Formulas:
$ PV = \frac{FV}{(1 + r)^t} = FV (1 + r)^{-t} $
$ \text{Annuity payment} = \frac{r \times PV}{1 - (1 + r)^{-t}} $
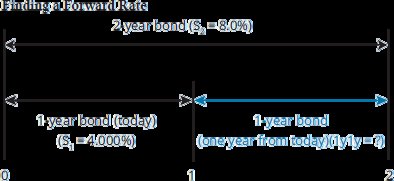
Forward Rates and the No-Arbitrage Principle
The cash flow additivity principle underpins the no-arbitrage condition, which states that two sets of identical future cash flows must have the same present value. This is used in deriving forward interest rates.
Statistical Measures of Asset Returns
Central Tendency and Dispersion
Measures of central tendency (mean, median, mode) and dispersion (range, variance, standard deviation) are essential for analyzing investment returns.
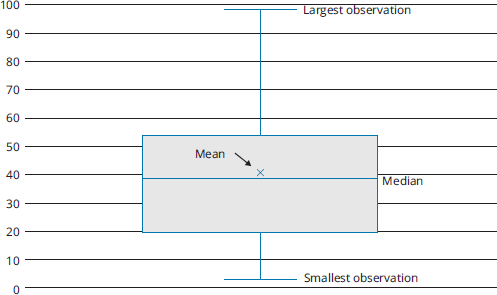
Box and Whisker Plot: Visualizes the distribution, showing median, mean, and range.
Target Downside Deviation
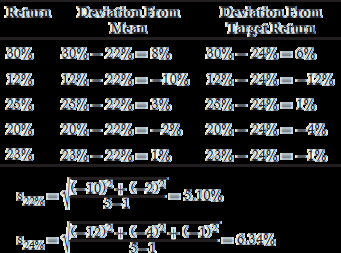
Measures the risk of returns falling below a target value, focusing on downside risk.
Kurtosis and Skewness
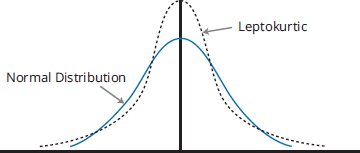
Skewness measures asymmetry; kurtosis measures the "peakedness" and tail thickness of a distribution. Leptokurtic distributions have fatter tails than normal distributions, indicating higher probability of extreme outcomes.
Correlation and Covariance
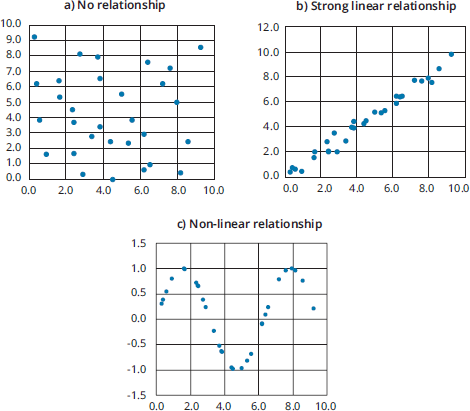
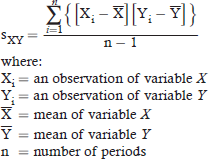
Correlation measures the strength and direction of a linear relationship between two variables. Covariance measures how two variables move together.
Additional Info
All images included are directly relevant to the explanation of the adjacent paragraph and reinforce key quantitative concepts.
Formulas are provided in LaTeX format for clarity and academic rigor.
These notes are suitable for exam preparation in Financial Accounting and related quantitative methods courses.
