 뒤로
뒤로Risk and Return: Fundamentals, Measurement, and Portfolio Theory
스터디 가이드 - 스마트 노트
 자료에 맞춘 맞춤형 노트, 핵심 정의, 예시, 맥락을 확장해 제공합니다.
Risk and Return in Financial Decision-Making
Overview of Risk and Return
Understanding risk and return is fundamental to financial decision-making. Investors require compensation for deferring consumption, expected inflation, and the uncertainty associated with investments. The expected return on an investment is composed of the risk-free rate and a risk premium, which compensates for additional risk.
Risk-free rate: The return on a theoretically riskless investment, such as government bonds.
Risk premium: Additional return required for taking on risk beyond the risk-free asset.
Sources of Risk
Risks affecting investments can be classified as follows:
Business risk: Uncertainty in a firm's earnings due to its operations.
Financial risk: Risk from the use of debt financing.
Interest rate risk: Risk from fluctuating interest rates.
Liquidity risk: Risk of not being able to sell an asset quickly at fair value.
Market risk: Risk from overall market movements.
Event risk: Risk from unexpected events (e.g., strikes, lawsuits).
Exchange rate risk: Risk from changes in currency values.
Purchasing power risk: Risk from inflation eroding returns.
Tax risk: Risk from changes in taxation.
Moral risk: Risk from unethical behavior.
Measuring Return and Risk
Return Calculation
The return on an investment is the change in its value over time, including cash distributions and capital gains or losses. The formula for a single period return is:
Formula:
Where = price at time t, = price at time t-1, = cash distributions during period t.
Expected Return
Expected return is the probability-weighted average of possible returns:
Formula (probabilities known):
Formula (historical data):
Example: Calculating expected return for a new product:
Prj | rj |
|---|---|
0.10 | -10% |
0.30 | 0% |
0.40 | 15% |
0.20 | 25% |
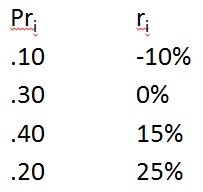
Expected return: or 10%.
Measuring Risk: Variance and Standard Deviation
Risk is measured by the variability of returns, typically using variance and standard deviation:
Variance:
Standard deviation:
Example: If the expected risk (standard deviation) is 11.2%, this quantifies the variability around the mean return.
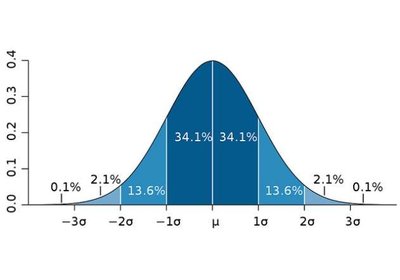
Interpretation: Low standard deviation indicates low risk (returns are closely clustered around the mean), while high standard deviation indicates high risk (returns are widely dispersed).
Coefficient of Variation (CV)
The coefficient of variation measures risk per unit of return, allowing comparison between investments:
Formula:
A higher CV indicates higher risk per unit of return.
Fund | Return | Standard Deviation | CV |
|---|---|---|---|
Fixed | 7.00% | 7.14% | 1.02 |
Growth | 12.00% | 13.49% | 1.12 |
Growth Fund has higher risk per unit of return compared to Fixed Fund.
Diversification and Portfolio Theory
Diversification
Diversification involves spreading investments across various assets to reduce risk. The principle is that not all assets will perform poorly at the same time, thus reducing the overall risk of the portfolio.
Historical example: Ancient traders spread goods across multiple ships to minimize loss from storms.

Risk Reduction through Diversification
By combining assets with less than perfect positive correlation, portfolio risk can be reduced. The goal is to create an efficient portfolio that maximizes return for a given level of risk or minimizes risk for a given level of return.
As more securities are added, marginal risk reduction decreases.
Types of Risk
Diversifiable risk (unique, non-systematic): Risk specific to a company or industry, can be eliminated through diversification.
Non-diversifiable risk (market, systematic): Risk affecting the entire market, cannot be eliminated by diversification (e.g., interest rates, inflation).
Portfolio Expected Return and Risk
The expected return of a portfolio is the weighted average of the returns of the individual assets:
Formula:
Where is the weight of asset j in the portfolio.
Portfolio risk depends on the standard deviations of the assets and the correlation between their returns. For a two-asset portfolio:
Formula:
Where is the correlation coefficient between the two assets.
Lower correlation between assets leads to greater risk reduction.
Correlation Coefficient | Portfolio Standard Deviation |
|---|---|
+1.0 | 10.3% |
0.0 | 7.6% |
-1.0 | 3.2% |
As correlation decreases, portfolio risk decreases.
Capital Asset Pricing Model (CAPM)
CAPM Formula and Variables
The CAPM provides a model for determining the required return on an asset, considering both the time value of money and risk:
Formula:
Where:
= required return on asset j
= risk-free rate
= beta coefficient for asset j
= expected market return
Beta (): Measures the sensitivity of an asset's returns to market returns. A beta of 1 means the asset moves with the market; less than 1 means less volatile; greater than 1 means more volatile.
Formula:
Where is the correlation between asset j and the market, is the standard deviation of asset j, and is the standard deviation of the market.
Market risk premium: is the extra return required to invest in the market over the risk-free rate.
CAPM Example
Given: Beta = 2.4, = 3.6%, = 8.7%
or 15.84%
The security risk premium is .
Graphing the CAPM
The Security Market Line (SML) plots required return against beta. Changes in market risk aversion or inflation shift the SML.
CAPM in Practice
Betas are estimated using historical data but may be adjusted for future expectations.
CAPM is widely used to estimate required returns for shareholders and to assess investment opportunities.
