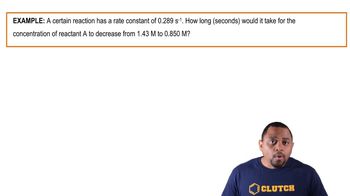
What does the integrated rate law describe in chemical kinetics?
It describes the relationship between reactant concentrations and time, helping determine how long it takes for a certain amount of reactant to be consumed.
What is the general form of the integrated rate law for a zero order reaction?
The equation is [A]t = -kt + [A]0, where [A]t is the final concentration, k is the rate constant, t is time, and [A]0 is the initial concentration.
How do you identify a zero order reaction from a concentration vs. time plot?
A zero order reaction shows a straight line with a negative slope when plotting concentration versus time.
What are the units of the rate constant (k) for a zero order reaction?
The units are molarity per time (e.g., M/s).
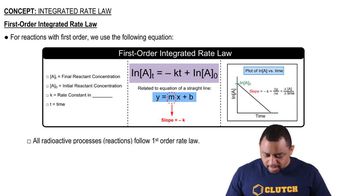
What is the integrated rate law equation for a first order reaction?
The equation is ln([A]t) = -kt + ln([A]0).
How can you recognize a first order reaction from a graph?
A plot of the natural logarithm of concentration (ln[A]) versus time yields a straight line with a negative slope.
What are the units of the rate constant (k) for a first order reaction?
The units are time inverse (e.g., 1/s).
What type of chemical process always follows a first order rate law?
Radioactive decay processes always follow a first order rate law.
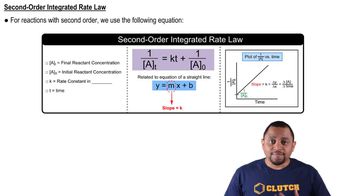
What is the integrated rate law equation for a second order reaction?
The equation is 1/[A]t = kt + 1/[A]0.
How do you identify a second order reaction from a plot?
A plot of the inverse of concentration (1/[A]) versus time gives a straight line with a positive slope.
What are the units of the rate constant (k) for a second order reaction?
The units are molarity inverse per time (e.g., 1/(M·s)).
How does the slope of the line differ for zero, first, and second order integrated rate law plots?
Zero and first order plots have a negative slope (−k), while the second order plot has a positive slope (k).
What variable is always plotted on the x-axis in integrated rate law graphs?
Time (t) is always plotted on the x-axis.
What is the significance of the y-intercept in integrated rate law plots?
The y-intercept represents the initial concentration or its transformation (e.g., [A]0, ln[A]0, or 1/[A]0) depending on the reaction order.
How can you use the integrated rate law to determine the order of a reaction from experimental data?
By plotting the appropriate function of concentration versus time and identifying which plot yields a straight line, you can determine the reaction order.
 뒤로
뒤로
 01:59
01:59