 뒤로
뒤로Analyzing Activation Energy and Enthalpy from a Reaction Energy Diagram
스터디 가이드 - 스마트 노트
 자료에 맞춘 맞춤형 노트, 핵심 정의, 예시, 맥락을 확장해 제공합니다.
Q17. What is the activation energy in the graph to the right? What is the delta H of the reaction? Would the delta H be the same for the reverse reaction?
Background
Topic: Reaction Energy Diagrams (Potential Energy vs. Reaction Pathway)
This question tests your understanding of how to interpret energy diagrams for chemical reactions, specifically how to determine activation energy and enthalpy change (ΔH) from the graph. It also asks you to consider whether ΔH is the same for the reverse reaction.
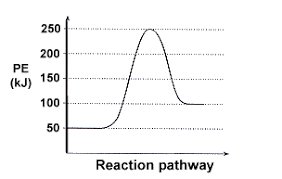
Key Terms and Formulas:
Activation Energy (Ea): The minimum energy required for a reaction to occur, represented by the energy difference between the reactants and the peak of the curve.
ΔH (Enthalpy Change): The difference in potential energy between the products and reactants. It indicates whether the reaction is exothermic (ΔH < 0) or endothermic (ΔH > 0).
Key Formulas:
Step-by-Step Guidance
Identify the energy value for the reactants (the starting point on the y-axis).
Find the energy value at the peak of the curve (the highest point on the graph).
Calculate the activation energy by subtracting the energy of the reactants from the energy at the peak.
Determine the energy value for the products (the ending point on the y-axis).
Calculate ΔH by subtracting the energy of the reactants from the energy of the products.
Try solving on your own before revealing the answer!
Final Answer:
Activation energy is 200 kJ, Delta H is +50 kJ. The reverse reaction would have a delta H of -50 kJ.
Activation energy is the difference between the peak and the reactants, and ΔH is the difference between products and reactants. For the reverse reaction, ΔH changes sign.
