 뒤로
뒤로Phase Diagrams and Liquid-Vapour Equilibria in Two-Component Systems
스터디 가이드 - 스마트 노트
 자료에 맞춘 맞춤형 노트, 핵심 정의, 예시, 맥락을 확장해 제공합니다.
Phase Diagrams of Two-Component Systems
Introduction to Liquid-Vapour Equilibrium
Liquid-vapour equilibrium in two-component systems is a fundamental concept in physical chemistry, describing how mixtures of two volatile components behave under varying conditions of temperature, pressure, and composition. These systems are often represented using phase diagrams, which provide valuable information about the states of matter present and the compositions of each phase.
Vapour Pressure-Composition Diagrams (Constant Temperature)
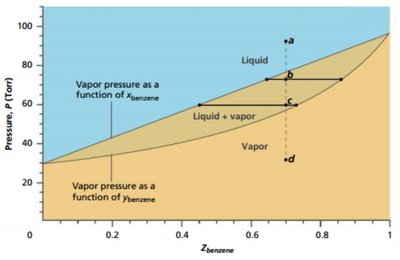
For an ideal mixture of two volatile liquids (e.g., components B and C), the total vapour pressure at a fixed temperature can be plotted against the overall mole fraction of one component (e.g., xB). These diagrams help visualize the regions where only liquid, only vapour, or both phases coexist.
Raoult’s Law: For an ideal solution, the partial vapour pressure of each component is proportional to its mole fraction in the liquid phase and its pure component vapour pressure:
Dalton’s Law: The total pressure is the sum of the partial pressures of each component in the vapour phase.
Regions in the Diagram: The diagram is divided into three regions: only liquid, only vapour, and a two-phase region where liquid and vapour coexist.

Interpreting the Phase Diagram
As pressure is reduced at constant temperature, the system transitions from a single liquid phase to a two-phase region (liquid + vapour), and finally to a single vapour phase. The compositions of the coexisting phases can be determined using the diagram and Raoult’s Law.
Example: If the overall composition is xB, the vapour phase first appears at a pressure where the sum of the partial pressures equals the applied pressure.

Lever Rule
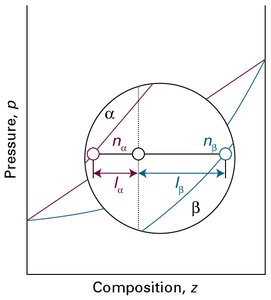
The lever rule is a graphical method used to determine the relative amounts of each phase present in the two-phase region of a phase diagram. It applies to both pressure-composition and temperature-composition diagrams.
Definition: The lever rule relates the lengths of tie lines in the two-phase region to the amounts of each phase:
Where nα and nβ are the amounts of phases α and β, and lα and lβ are the lengths of the tie line segments from the overall composition to the phase boundaries.
Temperature-Composition Diagrams (Constant Pressure)
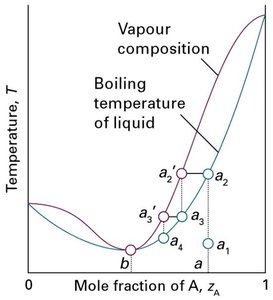
When pressure is held constant (e.g., at 1 atm), the boiling points of mixtures of two volatile components can be plotted against composition. These diagrams show the temperatures at which boiling begins and ends for different compositions.
Boiling-Point Curve: The lower curve represents the temperature at which the liquid starts to boil (liquid composition), and the upper curve shows the composition of the vapour in equilibrium with the boiling liquid.
Fractional Distillation: Repeated boiling and condensation steps enrich the more volatile component in the vapour phase, allowing for separation of components.

Applications of Phase Diagrams
Laboratory and Industrial Distillation
Distillation is a common method for separating components of a liquid mixture based on differences in volatility. Laboratory distillation setups and industrial fractionating columns utilize the principles of liquid-vapour equilibrium and phase diagrams to achieve separation.
Laboratory Distillation: Simple distillation can separate components with significantly different boiling points.

Fractionating Columns: Industrial columns allow for continuous separation and collection of fractions with different compositions at various heights in the column.

Non-Ideal Solutions and Azeotropes
Non-Ideal Behaviour and Azeotropes
Not all mixtures behave ideally. Non-ideal solutions can exhibit maximum or minimum boiling points, leading to the formation of azeotropes—mixtures that boil at a constant temperature and cannot be separated by simple distillation.
Azeotrope: A mixture of two or more liquids whose proportions cannot be changed by simple distillation due to a constant boiling point.
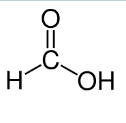
Types: Low-boiling azeotropes (e.g., chloroform and methanol) and high-boiling azeotropes (e.g., water and formic acid).
Example: Ethanol and water form an azeotrope, making it impossible to obtain pure ethanol by fractional distillation alone.

Worked Example: Raoult’s Law and Vapour Composition
Calculating Vapour Pressure and Composition
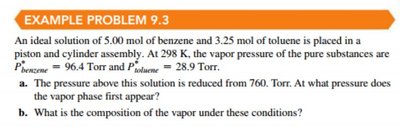
Consider an ideal solution of benzene and toluene. Given the number of moles and vapour pressures of the pure substances, Raoult’s Law can be used to determine the pressure at which vapour first appears and the composition of the vapour phase.
Step 1: Calculate the mole fractions of each component in the liquid phase.
Step 2: Apply Raoult’s Law to find the total vapour pressure at which vapour first appears.
Step 3: Use Dalton’s Law to determine the composition of the vapour phase.
Summary Table: Key Concepts in Two-Component Phase Diagrams
Concept | Description | Equation |
|---|---|---|
Raoult’s Law | Partial vapour pressure proportional to mole fraction in liquid | |
Dalton’s Law | Total pressure is sum of partial pressures in vapour | |
Lever Rule | Determines relative amounts of phases in two-phase region | |
Azeotrope | Mixture with constant boiling point, cannot be separated by distillation | — |
