
The apparatus shown here has two gas-filled containers and one empty container, all attached to a hollow horizontal tube. Assume that the containers are of equal volume and ignore the volume of the connecting tube. Which gas has the greater partial pressure after the valves are opened?
Ch.10 - Gases
10장, 문제 9b
Consider the following graph. (b) If A and B refer to the same gas at two different temperatures, which represents the higher temperature?
검증된 단계별 안내1
Identify the axes of the graph. Typically, a graph involving gases will have pressure (P) on the y-axis and volume (V) on the x-axis.
Recall the ideal gas law: PV = nRT, where T is the temperature. For a given amount of gas (n) and constant R, the relationship between P and V at different temperatures can be analyzed.
Understand that at higher temperatures, the gas molecules have more kinetic energy, which affects the pressure and volume relationship.
Recognize that for the same gas at different temperatures, the curve representing the higher temperature will be further from the origin in a PV graph. This is because at higher temperatures, for the same volume, the pressure is higher.
Determine which curve (A or B) is further from the origin, indicating it represents the higher temperature.

비슷한 문제에 대한 검증된 영상 답변:
이 영상 해법은 위 문제에 도움이 된다고 튜터들이 추천한 것입니다.
영상 길이:
1m도움이 되었나요?
주요 개념
질문에 올바르게 답하기 위해 반드시 이해해야 하는 핵심 개념들은 다음과 같습니다.
Gas Laws
Gas laws describe the behavior of gases in relation to pressure, volume, and temperature. The most relevant laws include Boyle's Law, Charles's Law, and the Ideal Gas Law, which collectively explain how changes in temperature affect gas properties. Understanding these laws is crucial for interpreting graphs that depict gas behavior under varying conditions.
추천 영상:
가이드 코스
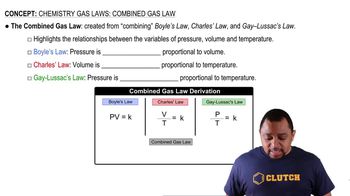
Combined Gas Law
Temperature and Kinetic Energy
Temperature is a measure of the average kinetic energy of the particles in a substance. In gases, higher temperatures correspond to greater kinetic energy, leading to increased particle movement. This relationship is fundamental when comparing the states of a gas at different temperatures, as it directly influences pressure and volume.
추천 영상:
가이드 코스
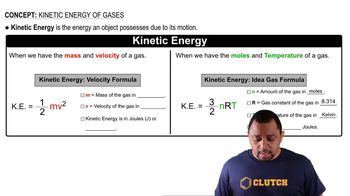
Kinetic Energy Formulas
Graph Interpretation
Interpreting graphs involves analyzing the plotted data to extract meaningful information. In the context of gas behavior, a graph may show temperature on one axis and another variable (like pressure or volume) on the other. Understanding how to read these graphs is essential for determining which conditions correspond to higher or lower temperatures based on the data presented.
추천 영상:
가이드 코스
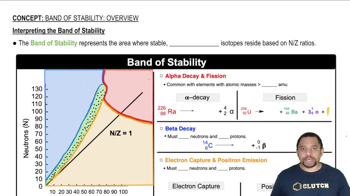
Intepreting the Band of Stability
관련 실천
교과서 질문
704
views
교과서 질문
Consider the following samples of gases:
If the three samples are all at the same temperature, rank them with respect to (c) density
431
views
교과서 질문
Consider the following samples of gases:
If the three samples are all at the same temperature, rank them with respect to (a) total pressure
783
views
교과서 질문
Consider the following graph. (c) For each curve, which speed is highest: the most probable speed, the root-mean-square speed, or the average speed?
534
views
교과서 질문
Consider the following graph. (a) If curves A and B refer to two different gases, He and O2, at the same temperature, which curve corresponds to He?
599
views
