Ch.14 - Chemical Kinetics
Brown - Chemistry: The Central Science 14th Edition
Brown14th EditionChemistry: The Central ScienceISBN: 9780134414232당신이 사용하는 게 아니라요?교과서 변경
14장, 문제 56

For the elementary process N2O5(g) → 2NO2(g) + NO3(g), the activation energy (Ea) and overall ΔE are 154 kJ/mol and 136 kJ/mol, respectively. (a) Sketch the energy profile for this reaction, and label Ea and ΔE.

검증된 단계별 안내
1
Step 1: Understand the energy profile of a chemical reaction. An energy profile is a graph that shows the energy changes during a chemical reaction. The y-axis represents the potential energy, while the x-axis represents the reaction progress.
Step 2: Identify the key components to be labeled on the energy profile. For this reaction, you need to label the activation energy (Ea) and the overall change in energy (ΔE).
Step 3: Draw the energy profile. Start by drawing a curve that begins at the energy level of the reactants (N2O5) and ends at the energy level of the products (2NO2 + NO3).
Step 4: Label the activation energy (Ea). The activation energy is the energy barrier that must be overcome for the reaction to proceed. It is represented by the peak of the curve minus the energy level of the reactants.
Step 5: Label the overall change in energy (ΔE). This is the difference in energy between the products and the reactants. Since ΔE is positive, the products are at a higher energy level than the reactants, indicating an endothermic reaction.

주요 개념

질문에 올바르게 답하기 위해 반드시 이해해야 하는 핵심 개념들은 다음과 같습니다.

Activation Energy (Ea)

Activation energy (Ea) is the minimum energy required for a chemical reaction to occur. It represents the energy barrier that reactants must overcome to transform into products. In the context of the given reaction, Ea is 154 kJ/mol, indicating the energy needed to initiate the conversion of N2O5 to products.
추천 영상:
가이드 코스
02:02
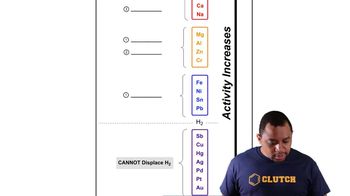
Activity Series Chart

Enthalpy Change (ΔE)

The enthalpy change (ΔE) of a reaction is the difference in energy between the reactants and products. It indicates whether a reaction is exothermic (releases energy) or endothermic (absorbs energy). For the given reaction, ΔE is 136 kJ/mol, suggesting that the products have lower energy than the reactants, thus releasing energy during the process.
추천 영상:
가이드 코스
02:34
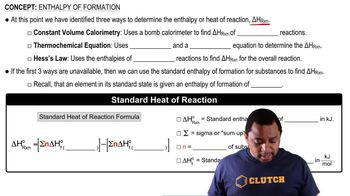
Enthalpy of Formation

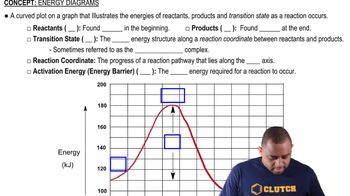
Energy Profile Diagram

An energy profile diagram visually represents the energy changes during a chemical reaction. It typically shows the energy of reactants, the peak representing the transition state (where activation energy is reached), and the energy of products. In this case, the diagram will illustrate the activation energy and the overall enthalpy change, providing insight into the reaction's energetics.
추천 영상:
가이드 코스
01:57
Energy Diagrams