
Ch.21 - Nuclear Chemistry
Brown - Chemistry: The Central Science 14th Edition
Brown14th EditionChemistry: The Central ScienceISBN: 9780134414232당신이 사용하는 게 아니라요?교과서 변경
21장, 문제 6a

The accompanying graph illustrates the decay of 8842Mo, which decays via positron emission. (a) What is the halflife of the decay? [Section 21.4]
Graph showing the decay of 72Se over time, illustrating radioactive half-life.

검증된 단계별 안내
1
Identify the initial mass of 7234Se from the graph at time t = 0 days.
Determine the mass of 7234Se at various time points to observe the decay pattern.
Find the time at which the mass of 7234Se is reduced to half of its initial value. This time is the half-life.
Verify the half-life by checking if the mass continues to halve at subsequent intervals of the same time period.
Conclude the half-life of 7234Se based on the consistent time intervals observed for the mass to reduce by half.

비슷한 문제에 대한 검증된 영상 답변:

이 영상 해법은 위 문제에 도움이 된다고 튜터들이 추천한 것입니다.
영상 길이:
2m

주요 개념

질문에 올바르게 답하기 위해 반드시 이해해야 하는 핵심 개념들은 다음과 같습니다.

Radioactive Decay

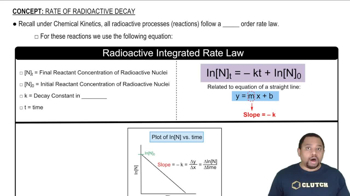
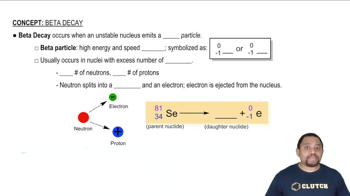
Radioactive decay is the process by which an unstable atomic nucleus loses energy by emitting radiation. This can occur in various forms, including alpha particles, beta particles, or gamma rays. In the case of positron emission, a proton in the nucleus is transformed into a neutron, releasing a positron and a neutrino. Understanding this process is crucial for analyzing the decay of isotopes like 88Mo.
추천 영상:
가이드 코스
03:00
Rate of Radioactive Decay

Half-Life

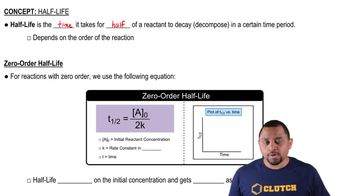
The half-life of a radioactive substance is the time required for half of the radioactive nuclei in a sample to decay. This concept is fundamental in nuclear chemistry and helps in predicting the behavior of radioactive materials over time. The half-life is a constant for each isotope and can be determined from decay graphs, where the time taken for the mass to reduce to half its initial value is measured.
추천 영상:
가이드 코스
02:17
Zero-Order Half-life

Decay Curve

A decay curve is a graphical representation of the decrease in the quantity of a radioactive substance over time. It typically shows an exponential decline, where the y-axis represents the remaining mass or activity, and the x-axis represents time. Analyzing the shape of the decay curve allows one to determine the half-life and understand the kinetics of the decay process, which is essential for solving problems related to radioactive isotopes.
추천 영상: