Ch.11 - Liquids and Intermolecular Forces
Brown - Chemistry: The Central Science 15th Edition
Brown15th EditionChemistry: The Central ScienceISBN: 9780137542970당신이 사용하는 게 아니라요?교과서 변경
11장, 문제 66

At 25°C gallium is a solid with a density of 5.91 g/cm3 and a melting point, 29.8°C, just slightly above room temperature. The density of liquid gallium just above the melting point is 6.1 g/cm3. Based on this information, what unusual feature would you expect to find in the phase diagram of gallium?

검증된 단계별 안내
1
Step 1: Understand the problem. The problem provides information about the density of gallium in its solid and liquid states. The density of solid gallium is less than the density of liquid gallium.
Step 2: Recall the general trend in phase diagrams. Typically, the solid phase of a substance is denser than its liquid phase. This is why, for most substances, the solid phase sinks in the liquid phase.
Step 3: Identify the unusual feature. Given that the density of solid gallium is less than the density of liquid gallium, we can infer that solid gallium would float in liquid gallium. This is an unusual feature.
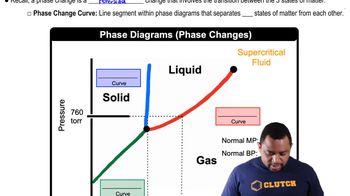
Step 4: Reflect this feature in the phase diagram. In a typical phase diagram, the line between the solid and liquid phases slopes to the right with increasing pressure. However, for substances like gallium where the solid is less dense than the liquid, this line would slope to the left. This is because increasing pressure would favor the phase with higher density, which is the liquid phase in this case.
Step 5: Conclude the solution. Therefore, the unusual feature you would expect to find in the phase diagram of gallium is that the line between the solid and liquid phases slopes to the left, indicating that the solid phase is less dense than the liquid phase.

비슷한 문제에 대한 검증된 영상 답변:

이 영상 해법은 위 문제에 도움이 된다고 튜터들이 추천한 것입니다.
영상 길이:
3m
도움이 되었나요?

주요 개념

질문에 올바르게 답하기 위해 반드시 이해해야 하는 핵심 개념들은 다음과 같습니다.

Phase Diagrams

A phase diagram is a graphical representation that shows the phases of a substance at various temperatures and pressures. It typically includes regions where the substance exists as a solid, liquid, or gas, and lines that indicate phase transitions. Understanding phase diagrams is crucial for predicting how a substance behaves under different conditions.
추천 영상:
가이드 코스
03:22
Phase Changes in Diagrams

Density Anomalies in Phase Changes

Most substances become denser as they transition from liquid to solid; however, gallium exhibits an unusual behavior where its solid form is less dense than its liquid form. This anomaly can lead to the solid phase floating on the liquid phase, which is contrary to the typical behavior of most materials. Recognizing this property is essential for interpreting gallium's phase diagram.
추천 영상:
가이드 코스
01:46
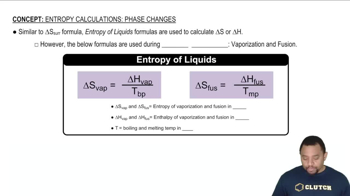
Entropy in Phase Changes

Melting Point and Phase Transition

The melting point is the temperature at which a solid becomes a liquid, marking a phase transition. For gallium, this occurs at 29.8°C, which is just above room temperature. This low melting point indicates that gallium can exist in both solid and liquid states at relatively mild temperatures, influencing its phase diagram and the behavior of its phases.
추천 영상:
가이드 코스
04:29
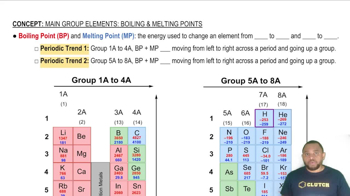
Boiling Point and Melting Point